


Experimental Probabilistic Winter Storm
Severity Index (ProbWSSI)
This display shows the Probabilistic WSSI for a period of 24 hours. Each time-step forward is 6 hours starting at 24 hours and extending to 168 hours. As you move forward in time using the slider bar you can see how the ProbWSSI is changing every six hours out to the end of the end of day 7 (168 hours). Select the tab with the element name of interest and then select the impact level radio button you are interested in.
|
USER GUIDE | HERE
|
PRODUCT DESCRIPTION DOCUMENT (PDD) | HERE
|
Comments? Provide feedback on the PWSSI |
|
|
|
Select PWSSI Impact Level: |
Keyboard HotKeys for slider: > next < previous |
Drag the slider or click the arrow buttons to display the probability forecast of impacts from
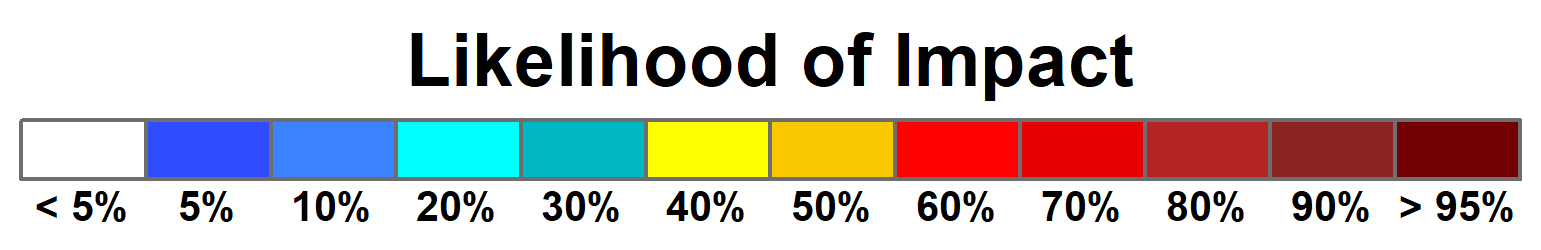
Click Legend for a detailed description of the impact levels
|
Change image opacity: |
|
Click image to enlarge 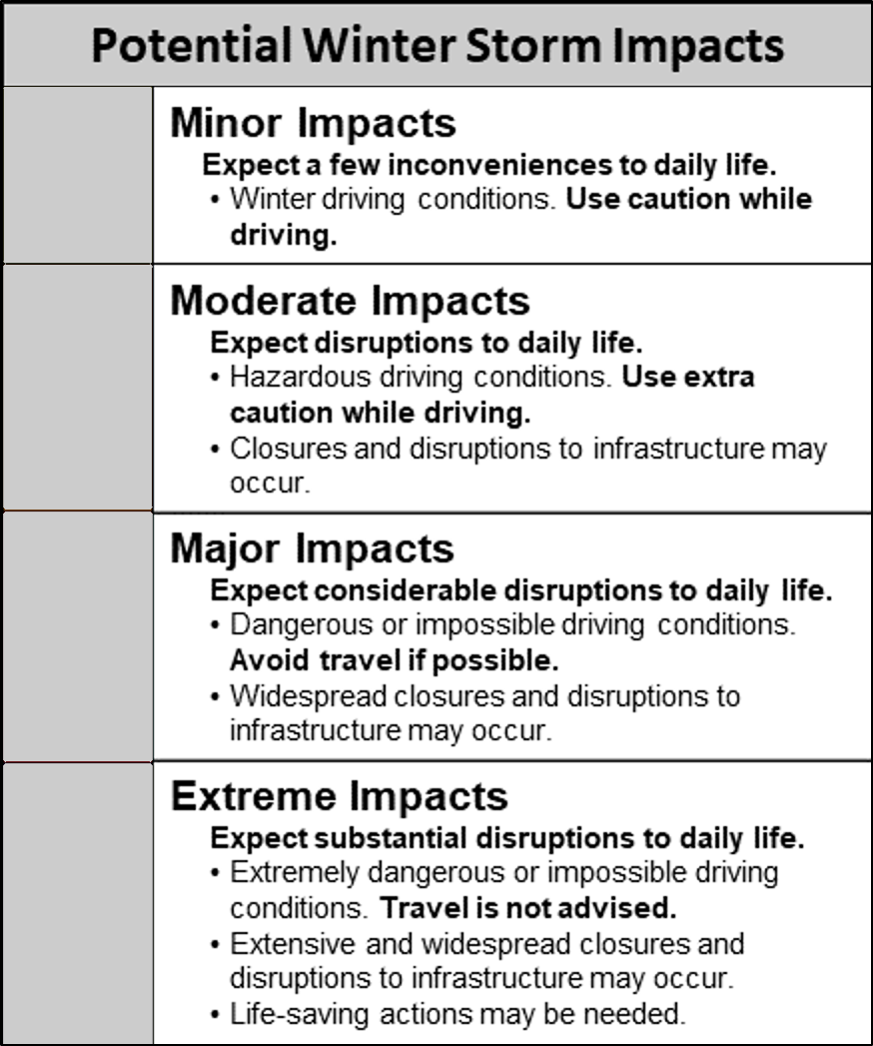
|
||