|
|
The Gálvez-Davison Index (GDI)

The GDI
(preliminary PDF),
is a thermodynamic index developed by the WPC International Desks in 2014,
to improve the forecasts of tropical convection, particularly in trade wind regimes.
It is a diagnostic tool that considers low and mid-tropospheric moisture, but emphasizes
(1) the stabilizing effects of mid-tropospheric ridges and
(2) the stabilizing and drying effects of trade wind inversions.
Real time GDI forecasts, using GFS data, are available in the following table.
|
GDI Forecasts from the Operational GFS
|
00Z |
06Z |
12Z |
18Z |
| 1. North America |
|
|
|
|
| 1.1. Southern and eastern US |
|
|
|
|
| 1.2. Mexico and the south western US |
|
|
|
|
| 1.3. Caribbean and Central America |
|
|
|
|
| 1.4. Puerto Rico (GDI and Other Fields) |
|
|
|
|
| 2. South America |
|
|
|
|
| 2.1. Tropical South America |
|
|
|
|
| 3. Africa |
|
|
|
|
| 4. Asia and the Maritime Continent |
|
|
|
|
| 5. Pacific Basin |
|
|
|
|
| 5.1. Hawaii |
|
|
|
|
| 5.2. Samoa |
|
|
|
|
| 5.3. Guam |
|
|
|
|
|
Table with loops using flash instead of html5
here.
|
Interpretation
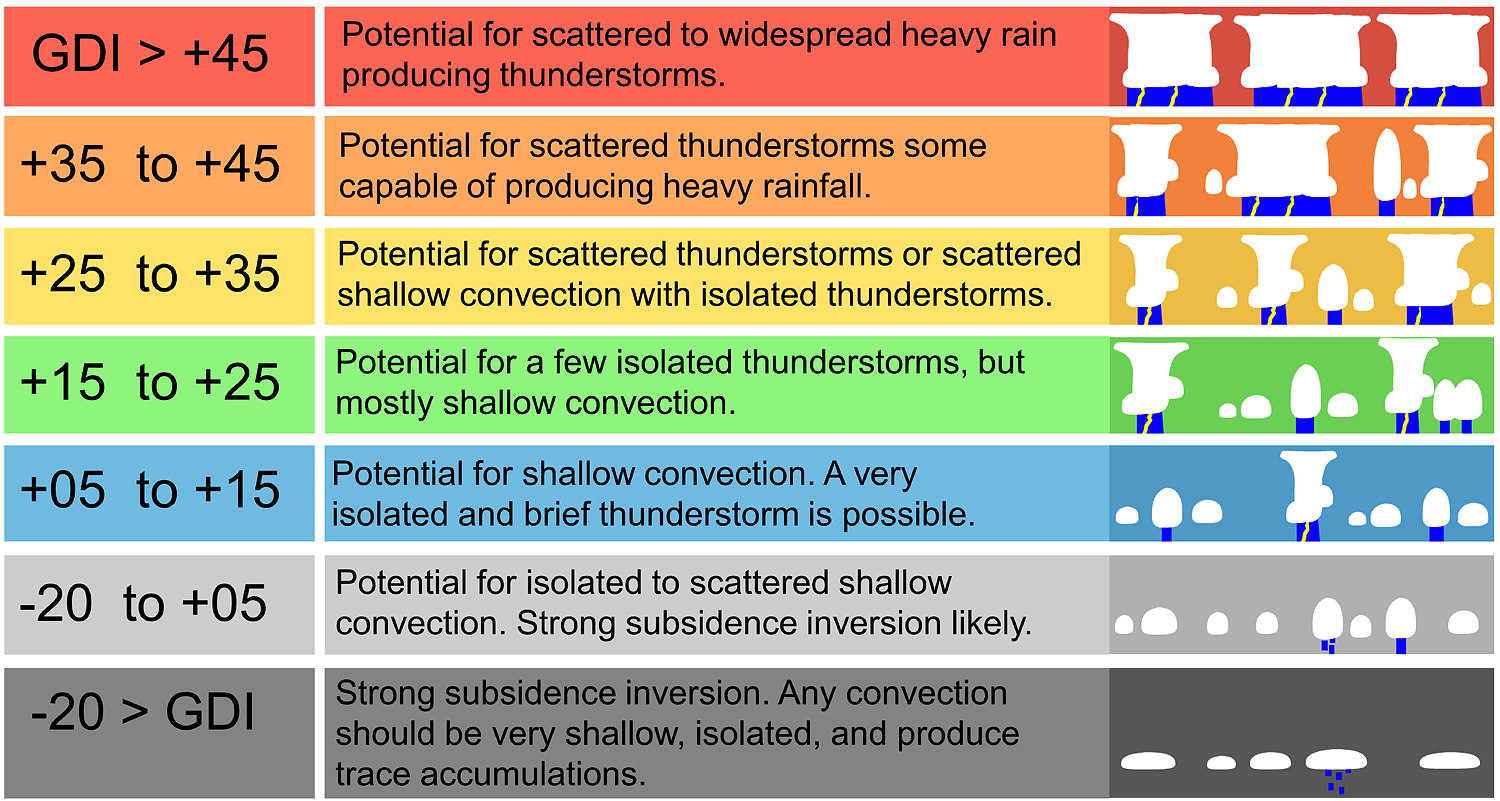
The higher the GDI, the larger the potential for deep convection. Very large GDI suggests potential for heavy rainfall.
Table 1 presents general guidelines for index value interpretation.
Yet, note that GDI skill and thresholds for types of convection vary
spatially and seasonally. Also, note that the GDI is a diagnostic tool, thus
its skill will depend on the database used for its calculation. Finally, combine
the GDI with an analysis of atmospheric dynamics for better forecasts, as the GDI
helps to describe the environment for tropical and subtropical convection, but
does not necessarily relate to regions of dynamically-induced ascent or descent.
More details on the GDI and how to code it are available on the
preliminary manuscript
and on Powepoint presentations available in English (
part I
and
part II
); and in Spanish (
part I
, and
part II ).
A presentation recorded on March 11, 2014, is also
available
. For any questions or feedback please email us at michel.davison@noaa.gov or jose.galvez@noaa.gov.
Table 1.
Correspondence between GDI values and expected type of convection. This is a table for general reference.
We recommend adjustments upon location and season.

|
|
|
Additional research on the GDI
-Miller et al., 2019: An Empirical Study of the Relationship between Seasonal Precipitation and
Thermodynamic Environment in Puerto Rico. Weather and Forecasting. 34, 277-288.
(Link)
-Miller et al., 2019: Persistent Hydrological Consequences of Hurricane
Maria in Puerto Rico. Geophysical Research Letters. Letter 10.1029/2018GL081591. 10pps.
(Link)
GDI for Wingridds
|
If you have Wingridds running in your computer, you can implement the GDI by downloading
this package
. Instructions on installation are included in the package.
|
|
|


