


Probabilistic Winter Storm
Severity Index (WSSI-P)
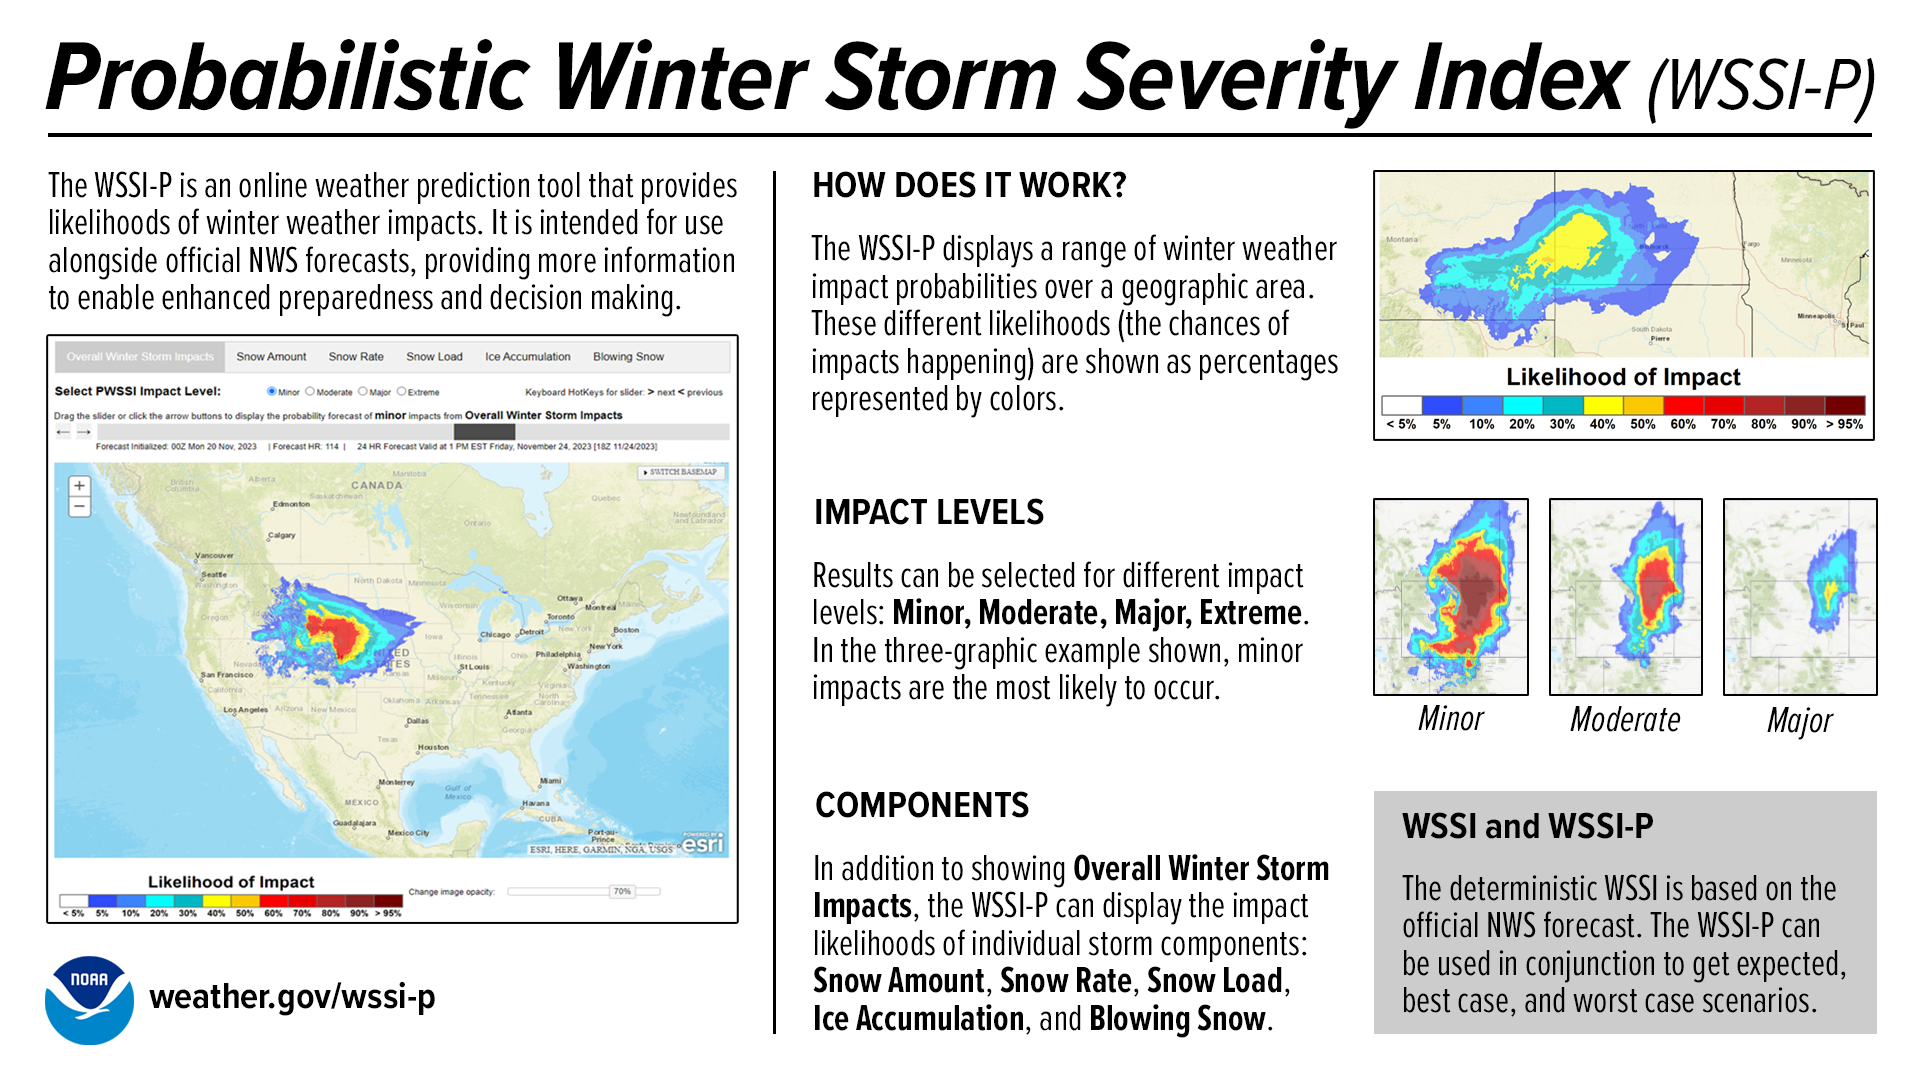
This display shows the Probabilistic WSSI for a period of 24 hours. Each time-step forward is 6 hours starting at 24 hours and extending to 168 hours. As you move forward in time using the slider bar you can see how the WSSI-P is changing every six hours out to the end of the end of day 7 (168 hours). Select the tab with the element name of interest and then select the impact level radio button you are interested in.
|
USER GUIDE | HERE
|
PRODUCT DESCRIPTION DOCUMENT (PDD) | HERE
|
INFOGRAPHIC | HERE |
|
|
|
Select WSSI-P Impact Level: |
Keyboard HotKeys for slider: > next < previous |
Drag the slider or click the arrow buttons to display the probability forecast of impacts from
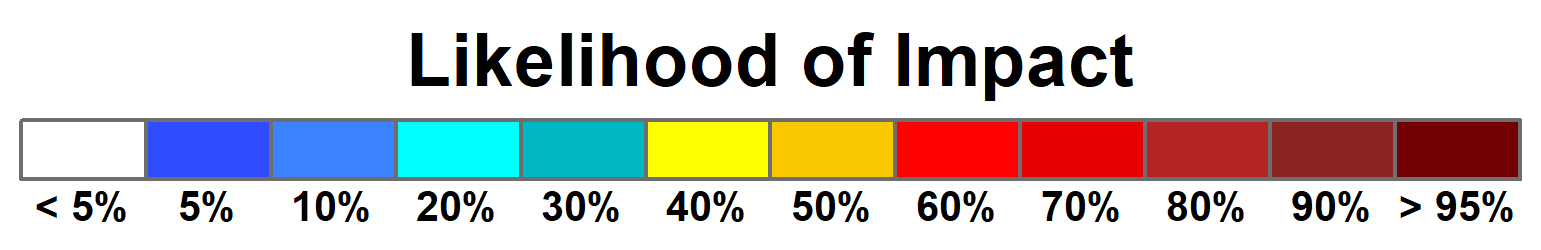
Click Legend for a detailed description of the impact levels
|
Change image opacity:
|
|
Click image to enlarge 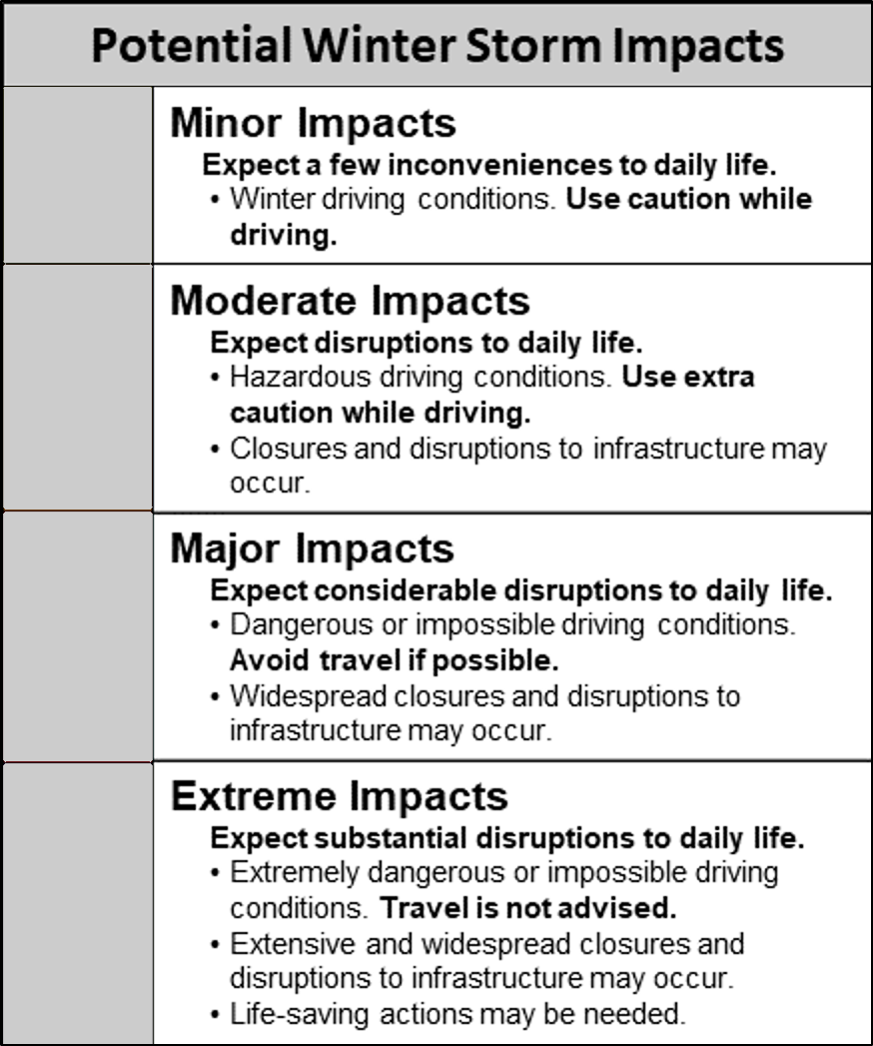
|
||