| WPC Met Watch |
|
|
Mesoscale Precipitation Discussion: #0849 (2022) |
|
(Issued at 824 PM EDT Mon Aug 22 2022
) |
|
| MPD Selection |
|
|
|
|
|

Mesoscale Precipitation Discussion 0849
NWS Weather Prediction Center College Park MD
824 PM EDT Mon Aug 22 2022

Areas affected...South-central to Southeastern North Carolina...

Concerning...Heavy rainfall...Flash flooding possible

Valid 230025Z - 230430Z

SUMMARY...Back-building wedge with training cores pose highly
focused flash flooding risk with 3-4" totals likely.

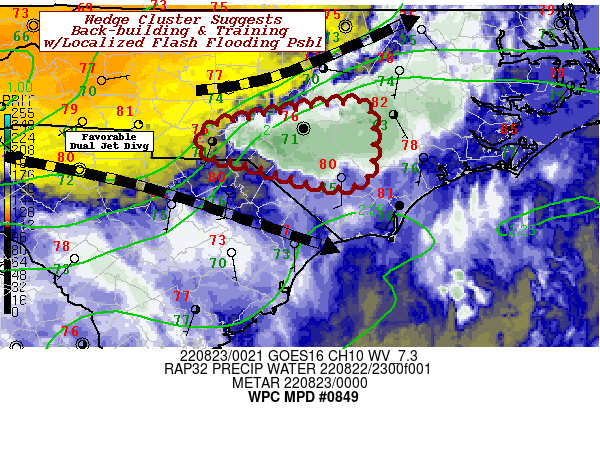
DISCUSSION...GOES-E 10.um IR loop depicts a classic wedge
convective cluster across Anson, Richomnd to Cumberland county NC.
WV suite and RAP analysis denotes the cluster has developed at the
base of the larger scale trough but in the split between the
entrance of a northern branch upper jet streak and the right exit
to the 250mb subtropical jet feature.   Additionally, the cluster
resides on the tight moisture gradient with TPW values of 2"
across the downwind edge.  Surface analysis denotes a weak surface
low or base to the Piedmont fall-line pressure trof that has
backed low level flow toward a favorable convergence with Tds in
the mid-70s. With the  mean mid-level trof still a bit upstream,
propagation vectors back and weaken slightly to support
redevelopment along the flanking line, which also happens to be
upstream to support short-term training.  As such, a streak of
3-4" totals is likely over the next 2-4 hrs as the upper-level
energy passes and the cluster weakens or starts forward
propagating.   Flash Flooding is only considered possible given,
3hr FFG values are in the 3-4" range, though the area is running
about 300-400% of normal over the last 7 days per AHPS.

Gallina

ATTN...WFO...ILM...RAH...

ATTN...RFC...SERFC...NWC...

LAT...LON   35447864 35407826 34727823 34497848 34567904
            34767969 34878014 35148016 35317948
Last Updated: 824 PM EDT Mon Aug 22 2022
|


