WPC Home
About the WPC
WPC Product Information
Current Products
Experimental Products
Satellite Imagery
Latest Radar Imagery
Current Watches/Warnings
Storm Summaries
WPC Verification
Model Diagnostics/Verif.
Daily Weather Map
Development and Training
International Desks
Tropical Products
What's New
FAQs
Other Sites
Meteorological Calculators
WPC's Day 4-8 Alaskan 500mb Height Forecasts
The images below represent 500mb height forecasts utilizing the latest operational models and/or GFS ensemble guidance.
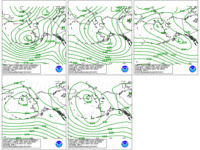
|
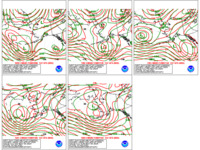
|
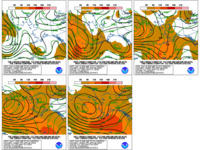
|
|
|
|
& Spread |
To view individual forecast days and day 4-8 loops, please click on the appropriate link below.
The following images represent WPC's forecast.
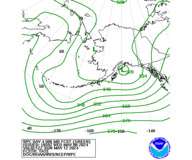
Day 4
|
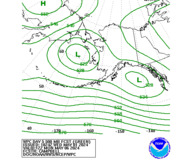
Day 5
|
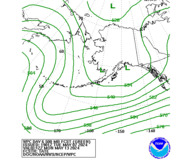
Day 6
|
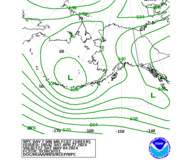
Day 7
|
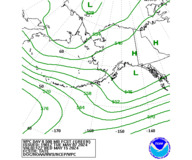
Day 8
|

Days 4 to 8
|
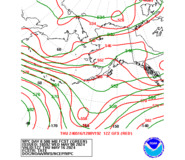
Comparison between the 00Z or 12Z GFS (in red) and WPC's forecast.
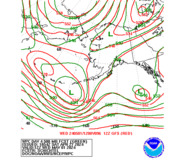
Day 4
|
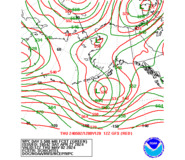
Day 5
|
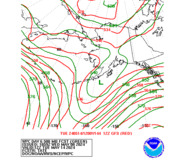
Day 6
|
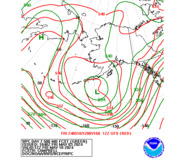
Day 7
|
Day 8
|

Days 4 to 8
|
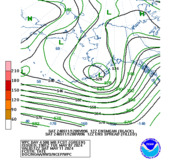
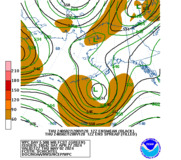
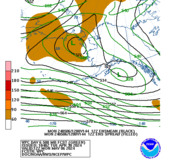
Comparison between the 00Z or 12Z GFS Ensemble Mean (in black) and WPC's forecast. The shaded regions represent the spread (in meters) of the ensemble forecasts.
Day 4
|
Day 5
|
Day 6
|
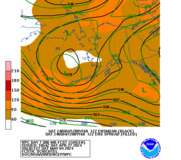
Day 7
|
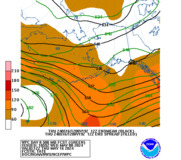
Day 8
|

Days 4 to 8
|