This horrific storm formed from a tropical wave...becoming a depression about
175 miles southeast of Nassau in the Bahamas on August 23rd. It became a
tropical storm the following day. Katrina moved northwestward through the
Bahamas...and then turned west-southwest into South Florida before turning
sharply south-southwest through Miami/Dade county as a minor hurricane,
dumping heavy rainfall to the left of the track, and high winds to southeast
Florida and the Florida Keys. As the system emerged into the Gulf of
Mexico it strengthened, reaching category 5 status on the 28th about 250
miles south-southeast of Burrwood, Louisiana. Its central pressure fell to
902 mb...the fourth lowest on record for the Atlantic Basin and lowest inside
the Gulf of Mexico...later that day. Katrina slowly recurved...moving through
lower Plaquemines Parish south of Buras with 140 mph winds at 610 AM CDT
on the 29th. Katrina made a second landfall near the mouth of the Pearl
River at 1000 AM CDT...with maximum sustained winds near 125 mph.
Katrina weakened as it moved inland to the north-northeast but was still a
hurricane 100 miles inland near Laurel, Mississippi. Katrina continued to
weaken and became a tropical depression near Clarksville, Tennessee
on the 30th. Katrina accelerated east-northeastward and was absorbed
into a developing extratropical cyclone to its northeast as it reached
central Pennsylvania.
Katrina will likely be recorded as the worst natural disaster in the history of
the United States...producing catastrophic damage and untold casualties in
the New Orleans area and along the Mississippi Gulf Coast...with additional
casualties in south Florida. As of August 10, 2006, the death toll was 1844:
238 in Mississippi
1577 in Louisiana
14 in Florida
9 in Alabama
2 in Georgia
2 in Ohio
2 in Kentucky
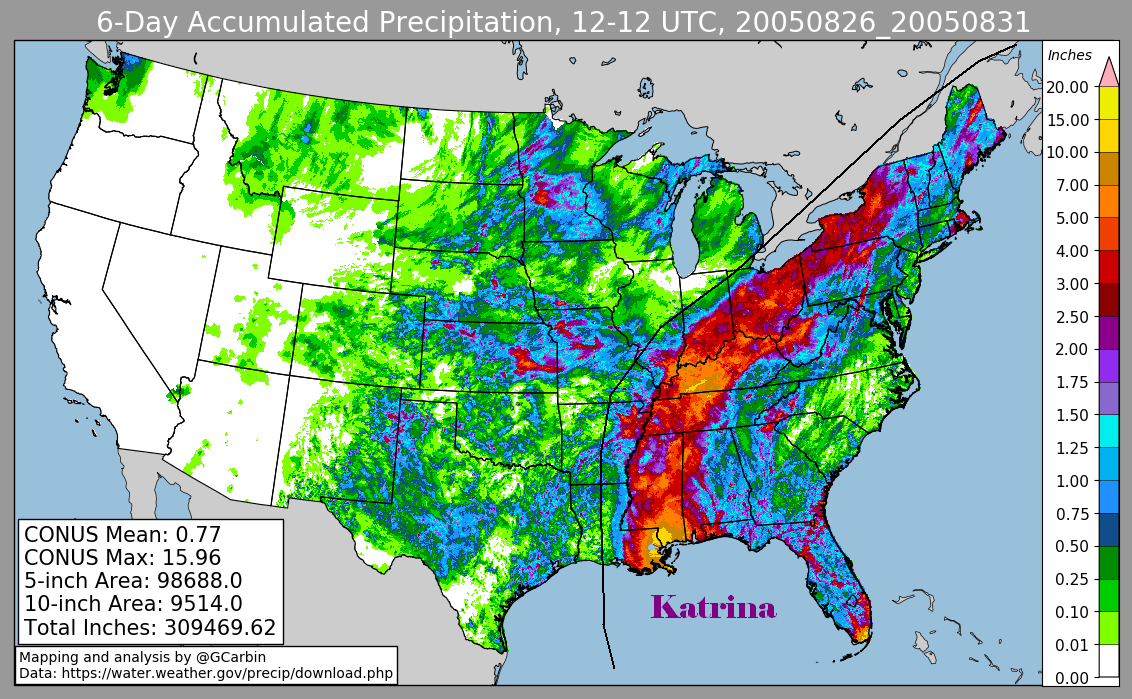
Below is a track of the cyclone, provided by the National Hurricane Center.
The first three storm total rainfall maps below were constructed using rain guage data
provided from NWS River
Forecast Centers, as well as additional reports
received by the local forecast offices from their
post-tropical cyclone reports. The fourth image used radar-derived information.
 |
 |
 |
 |
Daily calender of
rainfall amounts as of 12z, or 8 a.m. EDT that morning.
| Sun |
Mon |
Tue |
Wed |
Thu |
Fri |
Sat |
| 25 |
26 |
27 |
||||
| 28 |
29 |
30 |
31 |
1 |