|
In their article, they defined a heavy rainfall day as one in which Seattle (SEA), Olympia (OLM) and Stampede Pass (SMP), WA and Astoria (AST), OR all received 0.50 inches of rain. Heavy but certainly not extreme precipitation. The surface pressure gradient suggests that the precipitation might end up being considerably heavier than that. The long fetch implied by the pressure gradient also argues that a strong low level jet may help pull a plume of tropical moisture east-northeastward. |
|
12-hr GFS forecast of PW and 850-hPA winds valid 1200 UTC 6 Nov. 2006 |
|
24-hr GFS forecast of PW and 850-hPA winds valid 0000 UTC 7 Nov. 2006 |
|
The GFS forecasts of PW and 850-hPa winds indicate there is an impressive fetch of deep moisture and that there is definitely and atmospheric river associated with the event. One way to check if the model appears correct is by accessing the CIRA blended TPW product at http://amsu.cira.colostate.edu/TPW/global.htm. During this case, the blended product supported the model forecast PWs. The “pineapple express” or atmospheric river was going to be a player in the forecast.
|
|
Example continued |
|
An experienced forecaster would probably recognize that there was above normal PWs within this river but he or she still might not have an objective way of knowing how often such a plume occurs or how uncommon such high PWs are. The individual would have an even tougher time assessing a less commonly used diagnostic tool like moisture flux. Standardized anomalies offer a way of assessing how often the values of a particular meteorological field that are being forecast by the numerical models is present providing that the model has no bias in predicting that particular field. |
|
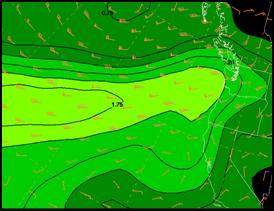
SREF ensemble mean PW (brown lines, in inches) and standardized PW anomaly (dashed red) valid 1200 UTC 6 Nov 2006 |

|
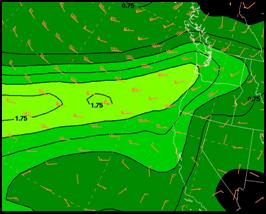
SREF ensemble mean PW (brown lines, in inches) and standardized PW anomaly (dashed red) valid 0000 UTC 7 Nov 2006 |

|
SREF ensemble mean PW (brown lines, in inches) and standardized PW anomaly (dashed red) valid 1200 UTC 7 Nov 2006 |
|
The SREF ensemble mean forecast of of a standardized PW anomaly of greater than 3 standard deviations (SD) is impressive since ensemble means average values so small differences in the location of the PW axis between the members tend to produce a broader moisture band and with lower maximum precipitable water than the individual members. Therefore, the high standardized anomalies suggest that there was strong agreement between the SREF members as to the location and movement of the band. The 3 SD anomaly or greater PW anomalies also indicate that over 99 percent of time the observed precipitable water is lower than is being forecast suggesting that the PWs being forecast are in the top 1% of events occurring during the same time of year. |


|
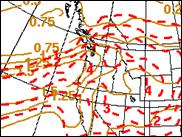
SREF 850-hPa moisture flux (g/kg) ms-1 and standardized magnitude of moisture flux anomaly valid 1200 UTC 6 Nov. 2006. |
|
SREF 850-hPa moisture flux (g/kg) ms-1 and standardized magnitude of moisture flux anomaly valid 0000 UTC 7 Nov. 2006. |
|
SREF 850-hPa moisture flux (g/kg) ms-1 and standardized magnitude of moisture flux anomaly valid 1200 UTC 7 Nov. 2006. |
|
The SREF ensemble mean 850-hPa moisture flux anomalies are even more impressive reaching over 5 standard deviations. Such a high standardized anomaly suggests that November observed moisture flux has rarely, if ever, exceeded the forecast values since 1950. Unless the SREF ensemble mean forecast of moisture flux has a high bias, this has the potential to possibly be a rare event. Such a slow moving moisture flux axis with such anomalously high moisture argues that this event might have the potential to be a historic one. |
|
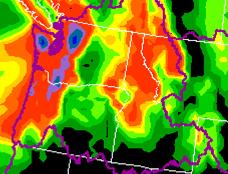
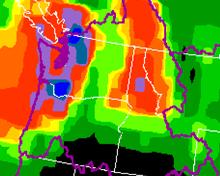
12-36 hr QPF from the NAM model, scale in inches at left. Depicted on a 32-km grid. |
|
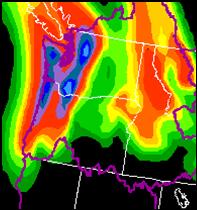
12-36 hr QPF from the GFS model. Depicted on a 32-km grid. |
|
When depicted on a 32-km grid, the NAM and GFS predicted a significant rainfall event, however, the areal distribution of the rainfall differed between the models. In a case like this one, it’s important to look at the NAM precipitation output at the highest resolution possible. The model with the better horizontal resolution of the terrain predicted less rain then the coarser resolution GFS. Both models predicted a relatively uncommon event but neither predicted amounts that suggested record rainfall might occur. However, the highly anomalous moisture flux and PWs suggested this could indeed be a near record or record event. |
|
Knowing that the SREF predicted moisture flux anomalies are suggesting that a rare heavy event might be in the offing, how might the forecaster modify the model forecasts below? |
|
12-36 hr QPF from the HPC forecaster. Depicted on a 32-km grid. |
|
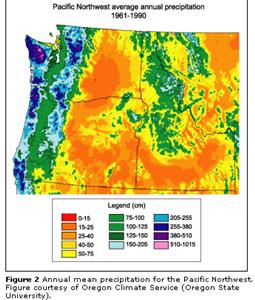
One aid to amending model forecasts in this type cases is to model rainfall maximum to the prism climatology areas where enhanced rainfall is likely and by making the changes based on how long the axis of highly anomalous moisture flux is situated over those regions. To a certain extend, the HPC forecast looks like it employed some form of this method. |
|
A |
|
B |
|
C |
|
D |
|
Four points are identified on the 12-36-hr HPC QPF. Looking at the SREF forecasts of moisture flux and the displayed of the normalized anomalies. Try to identify whether you would decrease or increase the rainfall over each of the 4 points. |
|
Let’s first look at point A. Note that point A is the heaviest location on the PRISM climatology. The SREF forecasts indicate that the moisture flux anomalies during the first 12 hours of the period are at least 4 standard deviations (sigma) and then decrease to 2-sigma by the end of the period. The GFS forecast only predicted between 3 and 4 inches across this region. The SREF moisture flux anomalies certainly argue for opting for the heavier forecast by the NAM over the Olympic mountains but also argue for more along the north coast of Oregon. The strength, anomalously high values of the moisture flux for an extended period and climatology might suggest that the rainfall at point “A” would be at least as high as point “C”.
The HPC prediction of the rainfall at point “B” compared the forecasts by either the NAM or GFS is a major improvement and is well supported by the moisture flux anomalies and climatology. Moisture flux anomalies are forecast to be above 3 sigma for 24 hours and are predicted to be above 5 sigma for over 12 hours. The anomalies at both point “B and “D” are indicative of a rare event. The PRISM climatology indicates that on average, point B will get more precipitation than point “D” (see below left). The combination suggests that point “B” might be a candidate for as much rainfall as point “D” despite the model forecasts to the contrary since the primary forcing is due to orography. |
|
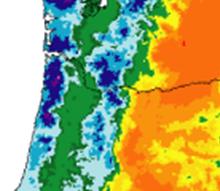
Reforecast product PQPF for 4.00 inches during the 24-hr period ending at 1200 UTC 7 Nov. 2006. |
|
The analog PQPF product based on retrospective forecasts (Hamill and Whitaker 2006) offers an aid for determining which areas are more likely to get the heaviest 24-hour rainfall. These product provide calibrated probabilities for various thresholds based on a 25-year set of probabilities. Note that the 4-inch probabilities were higher over the Olympic mountains than over the Washington Cascades near point “C”. The same holds for the coastal ranges near the coast compared to the Cascade Range near point “D”. The PQPF for various thresholds are available on the HPC workstations under NMAP2, GRIDS, analog PQPF. These products are also available on the Internet at http://www.cdc.noaa.gov/reforecast/narr/. |
|
B |
|
D |
|
B |
|
D |