|
On the evolution, shape and movement of MCSs |
|
Parker and Johnson (2000) have identified three linear MCS archetypes and indicated that the type that develops is dependent on the system’s relative wind field. One type is the trailing stratiform type (TS) which has convection along its leading edge and stratiform precipitation along its rear edge. |
|
This type of MCS develops when the system relative flow is from the front to the rear of the system. Note that on the right hand side of the figure that the line perpendicular flow (the arrows) is fairly strong from the surface to the mid-levels. Such a system typically propagates forward causing it to move faster than the mean flow which is the reason the system relative flow is from the front to the rear of the system.
A second type (LS) has stratiform precipitation along its leading edge with its convection along the rear edge of the storm. This type of system is typically much slower moving than the trailing stratiform archtype and has the system relative flow at upper levels working from the rear to the front of the system. New cells forming along the rear of the system tend to retard the system’s movement so the MCS moves slower than the mean flow.
A third type is the parallel stratiform type (PS). This latter type tends to translate with the speed of the associated mid-level trough with the mean flow generally aligned with the system. Most of the Maddox et al. synoptic type flash floods are associated with this latter type of system. Usually, the heavy rain producing PS type systems are associated with a slow-moving mid level trough.
Shumacher and Johnson identified two other archtypes. The first, the trailing line-adjoining stratiform system produced more extreme rainfall than any other type of MCS. Its cell motion is approximately parallel to the convective line which is parallel to the low level frontal boundary and on the cool side of the boundary. The overall structure of the MCS is influenced by the shear. The low-level winds are often perpendicular to the boundary and convective line while the mid level (cloud bearing) winds are parallel to the boundary. This type of MCS is usually associated with a stationary front, pre-existing outflow boundary or slow moving warm front.
|
|
From Hilgendorf and Johnson 1998 |
|
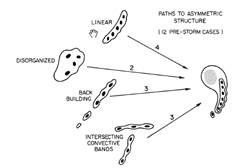
A number of researchers have documented that MCSs evolve in a number of ways (Bluestein 1997, Houze et al. 1990. Loehrer and Johnson 1995 have suggested there are at least four ways in which convection can organize into a linear MCS (see below). |
|
Which is the most untrue statement about a trailing stratiform |
|
A) they are usually aligned normal to the mean flow |
|
B) they are more likely to be associated with training of cells than a parallel stratiform MCS
|
|
C) they move faster than the mean flow within the cloud bearing layer |

|
It often occurs when the frontal boundary is oriented in a northwest to southeast direction. In this type case there is usually a trough or even closed low to the east which helps keep the mean mid level flow parallel to the low-level frontal boundary. A strong southwesterly low level jet is often impinging upon this boundary. Most HPC forecasters would think of this type of MCS as a Maddox frontal type. |
|
The second type they identified was the backbuilding/quasi-stationary archtype. They identified it as a separate archetype than the leading stratiform type but it is in many respects similar. Both types typically have propagation due to new cell growth act in the opposite direction as the movement of the individual cells which approximately move with the mean wind. |

|
The two main differences between the original Parker Johnson leading stratiform archtype and the back-building MCSs is that during the latter , its band of convection is typically oriented more parallel to the mid level flow than the leading stratiform which tend to be more perpendicular. My view is that the original Parker and Johnson leading stratiform type is rare. The back-building archtype is probably more common than the Parker and Johnson trailing stratiform type and produces more extreme rainfall events. It often develops a stratiform shield on its down-shear side. Generally, MCSs having stratiform precipitation on the east or northeast side are more likely to produce extreme rainfall than MCSs with their stratiform precipitation on the west side of the system. |
|
Doswell and his colleagues (1996) have discussed how the shape and movement of an MCS can help determine the rainfall that falls at any point. They developed the diagram below to explain how the shape of an MCS and its orientation with respect to its direction of movement can modulate the precipitation. The light blue dots represent the location where the theoretical rainfall rates would be observed for the each MCS. The arrows represent the direction of movement of the convective system and the red areas represent the brightest radar returns. The shaded grey area is the stratiform precipitation that often develops with various linear MCSs. When the convection is oriented normal to system’s direction of movement (the left hand side of the figure), a relatively brief period of heavy rainfall is expected. Conversely, when an MCS is oriented parallel to its direction of movement, a more prolonged period of intense rainfall is likely. |

|
The alignment of the low level convergence upstream with respect to the 850-300-hPa mean flow also appears to modulate precipitation (Junker et al. 1996). Low level convergence upstream from your location allows promotes the development of new cells providing the airmass is sufficiently moist and unstable. The Junker et al. figure below shows the length of the low level convergence that was parallel to the 850-300-hPa mean wind upstream from where the max precipitation was observed (vertical axis) and the analyzed precipitable water at the location where the heaviest rain was observed (bottom axis) just prior to Midwest rainfall events during the June-September period of 1993. The zeros plotted on the diagram represent events in which no 3 inch area was reported while the fours represent events in which there was a 3 inch or greater area of at least 3600 sq. nautical miles. The findings above suggest that the larger scale extreme rainfall events are more likely when a boundary is parallel to the mean flow of the cloud bearing layer. Such an alignment increases the likelihood that cells will train along the same axis. |

|
From Shumacher and Johnson 2006 |
|
From Shumacher and Johnson 2006 |
|
Note the deep storm relative winds (line-perpendicular component) for the TS type compared to the LS type |