|
West Coast cold season heavy rainfall events |


|
Extreme rainfall events along the west coast typically occur during the cold season from late fall to through spring. The figures below show the number of 4-inch per days by state during a 10-year period (1991-2000) for the west coast states during the various seasons based on the HPC precipitation analyses. Note that only 2 events were observed during the June-Aug period. |
|
A |
|
B |
|
C |
|
D |
|
Number of 4 inch events by state during A) fall , B) winter, C) spring, D) summer. |
|
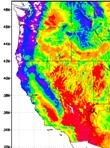
The wet season in the mountains from southern California northward into British Columbia is during the wet season (Neiman et al. 2007). The same study noted that most heavy rainfall events across this region were typically associated with atmospheric rivers (plumes of moisture) with the rainfall and that the magnitude of the rainfall seemed to be related to the magnitude of the integrated water vapor within the plume. The distribution of rainfall is linked closely to the terrain with a one group of maxima along the coastal ranges and another over the Cascade and Sierra Nevada ranges |
|
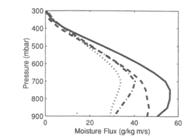
The figures above indicate the seasonal differences in the moisture, winds and moisture flux along the west coast. They imply that the cold season extreme rainfall maximum appears to be primarily due to the stronger winds and horizontal moisture flux in the cold season versus the warm season rather than due to large differences in the absolute moisture in the column (Pandey et al. 1999). |
|
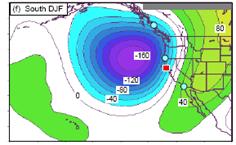
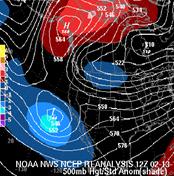
Pattern recognition remains an important component of forecasting extreme rainfall events along the west coast. The 500-hPa patterns that are associated with landfalling moisture plumes are very similar no matter which latitude along the coast they occur at. The two figures below are composite 500-hPa anomaly patterns associated with landfalling atmospheric rivers. The figure at left illustrates the pattern for when the river intersects the blue square. The right |

|
hand figure is the pattern associated with “rivers” that intersect at the red box and produce heavy rainfall in California. Note that each figure has a negative anomaly to the west northwest of location where the river intersects the coast and a positive anomaly to the south and east. The magnitude of the two anomalies differ with the pattern conducive to the northern intersection with the coast having a strong positive anomaly to the south and east than the pattern associated with the southern intersection. The configuration of both sets of anomalies ensures that deep southwesterly flow is present along and off the west coast. This deep southwesterly flow taps the moisture in the subtropics and helps produce the pineapple express. One of the best ways to monitor the moisture within any atmospheric river/pineapple express is by using satellite imagery and the CIRRA link (http://amsu.cira.colostate.edu/gpstpw). The product not only provides the total precipitable water (TPW) but when you scroll down indicates the percent of normal of the TPW. |

|
Climatological profiles of wind speed, specific humidity and moisture flux for the various seasons. Figure adapted from Pandey et al. 1999. |


|
Accumulated rainfall in inches from 6 different storms during a 9-day period (Feb 13-21, 1980) in southern California. |
|
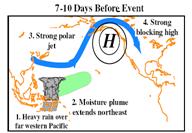
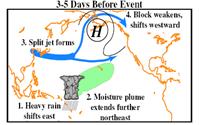
Convection associated with the Madden-Julian Oscillation play a role in influencing where extreme precipitation falls along the west coast (Bond and Vecchi 2003, Higgins et al. 2000, Mo and Higgins (1998). CPC has developed a schematic that roughly shows how the synoptic pattern, upper-level jet and moisture plume tends to respond to tropical forcing (see below). They note that as convection become enhanced near Indonesia that a strong blocking ridge develops and that as the convection moves eastward in response to the MJO that the subtropical jet starts undercutting the ridge which retrogrades and a trough amplifies to the south and east of the ridge. Concurrently, a moisture plume or atmospheric river begins to elongate northeastward and eventually impinges on the coast. |
|
500-hPa analysis of geopotential heights and of the standardized height anomalies for 1200 UTC 13 Feb 1980. |
|
West coast events, tropical convection and atmospheric rivers |
|
The Pacific jet exhibits fluctuates in response to tropical convection which in turn influences the large scale pattern. The placement of the Pacific jet plays a significant role in determining where and when major west coast rainfall events may occur. The changes in the seas surface temperatures associated with ENSO that influences the pattern along the west coast. The warmer sea surface temperatures in the East Pacific during El Nino years usually allows convection to extend east of the date line. The latent heating associated with this convection helps promote an eastward extension of the East Asian Jet and its associated exit region. During some El Nino years, especially the stronger ones, the exit region of the jet and its associated region of strong cyclogenesis becomes located just upstream from California. The southward shift of the jet and westerlies leads to a southward shift of the storm track (Bell and Higgins, 2005). Extreme rainfall events along the length of the west coast are most common during neutral years (Higgins et al. 2000) so they can occur during any season.
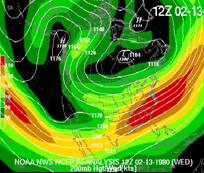
1980 was a weak El Nino, its pattern is fairly typical of the Nino associated pattern for heavy rains in southern California and Arizona. The upper level jet is suppressed southward, in this case, the jet cut under a blocking high. Not how the exit region of the jet extends eastward towards the coast and how height off the coast of California are much below normal. |

|
200-hPa analysis of geopotential heights and isotachs for 1200 UTC 13 Feb 1980. |
|
The block and suppressed jet helps produce a series of storms over the region. By contrast, during La Nina years, the cold SST over the east Pacific keep the convection confined to the western Pacific which leads to the exit region of the jet being much farther to the west which leads to the mean upper level ridge being located farther to the west and to above normal heights across California which pushes the jet northward towards Washington and Oregon (From Bell and Higgins 2005) |
|
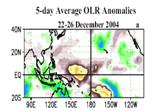
Mo and Higgens noted that drier than normal conditions were typical over California when the blob of convection associated with the MJO moved eastward to 120E. One way to assess the convection is by looking at negative anomalies of outward longwave radiation (OLR). Wet periods are more likely to occur develop as the convection shifts eastward with onset usually occurring when the convection approaches 150E.
|
|
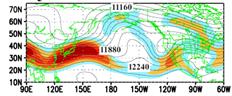
Bell and Higgins have noted that the evolution of the pattern over southwestern U.S. during the December 18, 2004-January. The area of green (lower values of outward longwave radiation) indicate on Fig. a indicates there is enhanced convection of Indonesia. At around the same time, note there was a trough and enhanced upper level jet just to its north and a block just off the coast of western Canada very similar to the pattern that typically occurs 7-10 days prior to a multi-day period of enhanced rainfall along the west coast. Note how the mean ridge then retrogresses westward and allows a trough to form off the coast of California. In this case, the first heavy rainfall event occurred earlier |

|
Mean 200-hPa heights and wind speeds v.t. 22 Dec. 2004 |
|
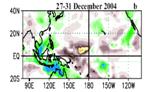
v.t. 28-29 Dec. 2004 |

|
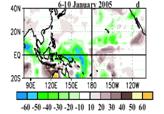
v.t. 7-11 January 2004 |
|
than would be expected by their schematic and occurred when the enhanced convection was still over Indonesia when the first major rainfall event occurred over southern California during the Dec 27-29 period. The early onset suggests caution is needed in following the timing of the schematic too closely. The MJO convection does not move steadily but in fits and starts. Chaos also plays a role in how patterns evolve. Not all heavy rainfall events are associated with the MJO. |
|
From Neiman et al. 2006 |