|
20-23 January 1970 event |

|
This event was a rather minor one in terms of significant flooding. The only reports of flooding that could be found on the Internet were a report of flooding on Cache Creek of the Copay valley and an allusion to two boys being missing due to flooding Jan. 26 issue of the European Stars and Stripes. Neither source elaborated on the flooding, so the flooding may not have even been associated with this event. |


|
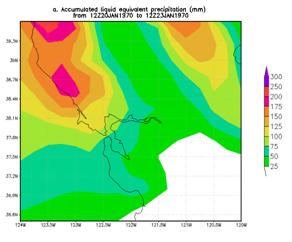
Heaviest 3-day rainfall analysis using the CDC .25 deg by .25 deg unified data set ending 1200 UCT 23 Jan 1970. |
|
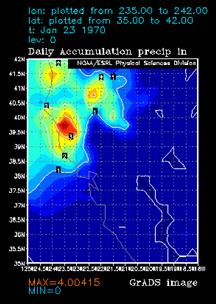
24-hr rainfall analysis (in inches) using the CDC .25 deg by .25 deg unified data set ending 1200 UCT 21 Jan 1970. |
|
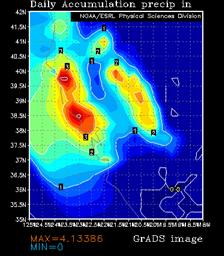
24-hr rainfall analysis (in inches) using the CDC .25 deg by .25 deg unified data set ending 1200 UCT 23 Jan 1970. |
|
This event, like most of these cases, was associated with a strong atmospheric river. However, heights over Alaska were not anomalously high even though there was a ridge across western Canada and eastern Alaska at 500-hPa (see below). Initially, the negative height anomaly south of Alaska was farther north than for many of the events. However, with time the anomaly strengthened as shifted south and the pattern became more similar to the patterns associated with the majority of the event. The negative anomaly formed a dipole with a positive height anomaly over much of California. This positive anomaly extended south-westward suggesting a stronger than normal gradient. |
|
Large area 4-panel chart, 200-hPa heights and isotachs (top left), 500-hPa heights and normalized height anomaly (top right), 850-hPa heights and normalized temperature anomaly (bottom left), and 1000-hPa height and normalized PW anomaly (bottom right) valid 1200 UTC 21 Jan 1970. The magnitude of the normalized anomalies are given by the color fill with the scale on the left had side of each panel. |
|
A ridge at 1000 and 850-hPa southwest of California and a cyclone associated with the negative height anomaly to the north helped tap into the atmospheric river. Above normal 850-hPa temps accompanied the “river” as it surged into California. An entrance region of a upper level jet streak may have provided additional lifting across northern California on January 23. |
|
PW (mm) and normalized PW anomaly (magnitude of the anomaly scale is shown on the scale at the bottom of the figure) valid 0600 UTC 21 Jan 1970 (top panel), 1200 UTC 21 Jan 1970 (bottom panel). |
|
850-hPa winds (standard barbs and flags) and normalized anomaly of 850-hPa moisture flux (magnitude is given by the color fill from the bar at the bottom of the figure) valid 0600 UTC 21 Jan 1970 (top panel), 1200 UTC 21 Jan 1970 (bottom panel). |
|
As noted earlier, the event was associated with high enough PW to be considered at strong atmospheric river. 850-hPa MF normalized anomalies approached 3 sigma while the normalized PW anomalies exceeded 3 on the Jan 21. Such anomalies argue to a heavy rainfall event, but not necessarily, a rare one. |

|
Same as figure above except for 1200 UTC 23 Jan 1970. |