

|
1200 UTC 18-21 Dec 1981 |
|
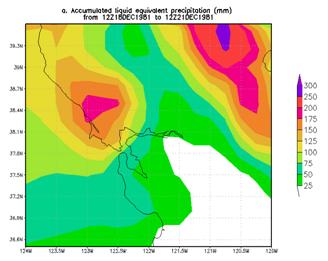
The 3-day period was the 13th largest grid point maximum on our list. The Syracuse Herald-American had a story from the morning of December 20th stating that killed 3 people, raised 4 rivers to flood stage and produced mud slides. However, compared to many of the events listed, the flooding during this case was relatively minor. The heaviest single day was during the 1200 UTC 18 Dec. to 1200 UTC 19 Dec. period. |

|
Heaviest 3-day rainfall analysis using the CDC .25 deg by .25 deg unified data set ending 1200 UCT 18 Dec 1981-1200 UTC 21 Dec 1981. |
|
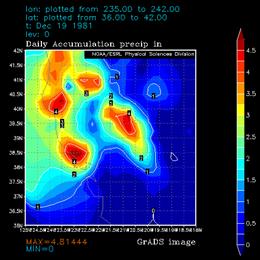
Heaviest 24-hr period ending 1200 UTC 19 Dec 1981. |
|
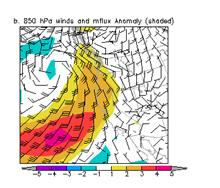
Like many of the events, this one was associated with an area of anomalously high 500-hPa heights at high latitudes. This time. the strong positive anomaly was over western Canada rather than Alaska or the Aleutian Islands as in most of the cases. Instead of being south of the positive anomaly, the negative anomaly was located to its west. However, south of this negative anomaly was a positive height anomaly. The negative/positive height couplet enhanced the gradient and helped produce a strong upper level jet. Southwesterly 850-hPa winds were located along the exit region of this jet streak. (see figure below). |
|
As with many of the events, a strong atmospheric river was present with anomalously high PW. This river was also associated with an associated area of above normal 850-hPa temperatures (see figure above). With time, the positive anomaly at 500-hPa that was located to the south of the negative elongated eastward while a greater than 2 sigma negative anomaly strengthened/developed west of northern California (not shown). This change gave the 500-hPa anomaly pattern more of a classic look with an implied long fetch of stronger than normal west-southwesterly geostrophic flow. |
|
Large area 4-panel chart, 200-hPa heights and isotachs (top left), 500-hPa heights and normalized height anomaly (top right), 850-hPa heights and normalized temperature anomaly (bottom left), and 1000-hPa height and normalized PW anomaly (bottom right) valid 1200 UTC 31 Dec. 1997. The magnitude of the normalized anomalies are given by the color fill with the scale on the left had side of each panel. |
|
PW (mm) and normalized PW anomaly (magnitude of the anomaly scale is shown on the scale at the bottom of the figure) valid 1800 UTC 18 Dec. 1981 (top panel), 0600 UTC 19 Dec. 1981 (bottom panel). |
|
850-hPa winds (standard barbs and flags) and normalized anomaly of 850-hPa moisture flux (magnitude is given by the color fill from the bar at the bottom of the figure) valid 1800 UTC 18 Dec. 1981 (top panel), 0600 UTC 19 Dec. 1981 (bottom panel). |

|
The moisture within the atmospheric river was impressive and highly anomalous. Normalized PW anomaly over California on the 19th exceeded 4 standard deviations. |