|
January 8-11, 1995 event |
|
The 3-day period ending at 1200 UTC 9 Jan ranked ninth on the list but heavy rain was reported across northern California through January 11th. 42 counties in California were included in the Federal Disaster Declaration due to this extended rainfall event. Sacramento and western Placer counties were particularly hard hit as many small streams overflowed their banks with disastrous results to adjacent properties (Curtis and Humphrey 1995). Serious flooding was also reported along the Napa river in St. Helena where the river peaked at 4.5 feet above flood stage. Significant flooding was also reported along the Russian River (California Dept Water Res. Bull 69-95). |

|
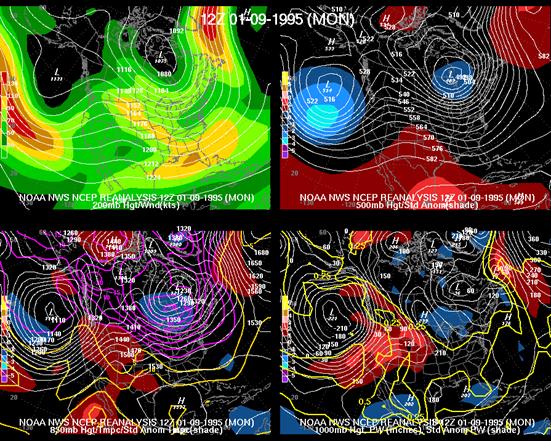
Large area 4-panel chart, 200-hPa heights and isotachs (top left), 500-hPa heights and normalized height anomaly (top right), 850-hPa heights and normalized temperature anomaly (bottom left), and 1000-hPa height and normalized PW anomaly (bottom right) valid 1200 UTC 09 Jan. 1995. The magnitude of the normalized anomalies are given by the color fill with the scale on the left had side of each panel. |
|
PW (mm) and normalized PW anomaly (magnitude of the anomaly scale is shown on the scale at the bottom of the figure) valid 0600 UTC 09 Jan. 1995 (top panel), 0000 UTC 10 Jan. 1995 (bottom panel). |

|
The synoptic pattern again was very similar to that of the majority of the cases. At 500-hPa, an impressive negative height anomaly was present off the coast of northern Pacific northwest coast and a positive height anomaly was located to its south. The placement and strength of the negative anomaly is similar to the placement of similar anomaly during the March 1995 event. Such a strong anomaly displaces the polar jet southward leading to cyclones develop farther south than normal. Like the majority of the events, the gradient implies strong southwesterly flow on the south and east side of the cyclone which taps the subtropics and pulls an atmospheric river northward. While the 500-hPa heights show no strong positive anomaly across Alaska or the Aleutian Islands, the heights do imply ridging across the Aleutian Islands. Note on the figure below that the 850-hPa temps were higher than normal suggesting high snow levels. |
|
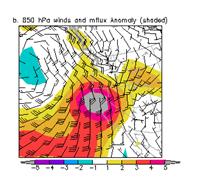
850-hPa winds (standard barbs and flags) and normalized anomaly of 850-hPa moisture flux (magnitude is given by the color fill from the bar at the bottom of the figure) valid 0600 UTC 09 Mar. 1995 (top panel), 1200 UTC 09 Jan. 1995 (bottom panel). |

|
The PW within the moisture plume was high enough for the atmospheric river to the classified as a strong one according to the Neiman et al. (2008)definition. However, the PW and its normalized anomaly values within the plume were lower than during the March 1995 event. During most of the event it exceeded 2 sigma but did not exceed 3. However, the strong pressure gradient and resulting winds still produced highly anomalous 850-hPa moisture flux with an extended period of greater than 4 sigma values being draped across the region by 0000 UTC 9 Jan. The anomaly then increased to over 5 sigma within the next 6 hours before again settling back to just under 5 sigma. The slow movement of the moisture plume and the extended period of very anomalous moisture flux favored an extreme rainfall event.
|

|
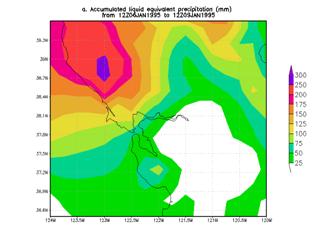
Heaviest 3-day rainfall analysis using the CDC .25 deg by .25 deg unified data set ending 1200 UCT 06 Jan 1995-1200 UTC 09 Feb 1995. |
|
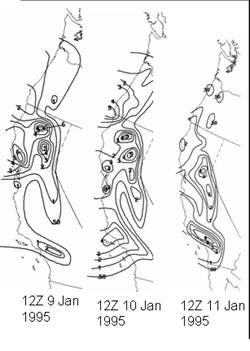
24-h HPC precipitation analysis with contours of 0.50, 1, 2, 3, 4, 5 and 6 inches ending at a) 1200 UTC 09 Jan 1995, b) 1200 UTC 10 Jan 1995, c) 1200 UTC 11 Jan 1995. |