|
17-20 November 1950 event |
|
The 1950 event was the 10th heaviest on the list. This event and another in early December led to significant flooding in Yuba and Tulare Counties and led to flooding of the Tule River and migrant worker lodging in Porterville (see picture below). Roos has listed it as one of the nine big floods of note for California (2007). The flooding was also serious enough in Nevada to prompt a U.S. Geological Survey report of the flooding. The peak streamflow on the Truckee river was the highest recorded until New Year’s 1997 event. |

|
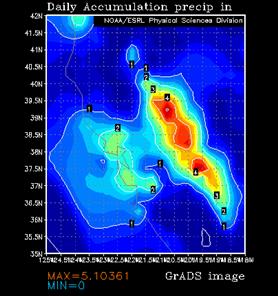
The 24 hr period of heaviest rain during the 3 day period. 24-hr CDC QPE ending 1200 UTC 18 Nov. 1950. |
|
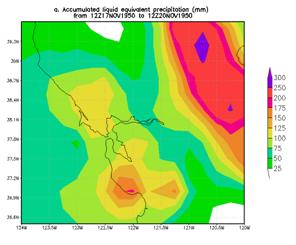
Heaviest 3-day rainfall analysis using the CDC .25 deg by .25 deg unified data set ending 1200 UCT 20 Nov. 1950. |
|
Picture of the flooding of the Tule River and migrant worker camp. |
|
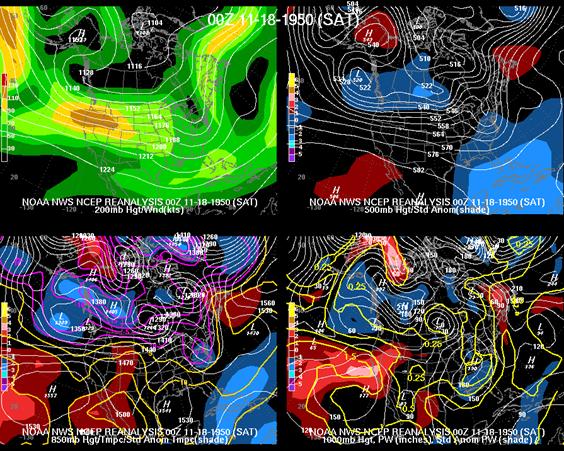
Large area 4-panel chart, 200-hPa heights and isotachs (top left), 500-hPa heights and normalized height anomaly (top right), 850-hPa heights and normalized temperature anomaly (bottom left), and 1000-hPa height and normalized PW anomaly (bottom right) valid 0000 UTC 18 Nov. 1950. The magnitude of the normalized anomalies are given by the color fill with the scale on the left had side of each panel. |
|
The synoptic pattern is a variation of the basic pattern. The 500-hPa height pattern on 0000 UTC 18 Nov. has a positive height anomaly over Alaska and a negative to its south. However, the gradient between the negative height anomaly located off the Pacific northwest the ridge over Baja weaker than during the majority of the cases during the first 24 hours of the event. However, anomalously high PW was present within the atmospheric river. |

|
The 500-hPa continued to evolve during the event and more closely matched the norm later during the event (see figure at left) as another stronger negative height anomaly developed under the block. The resulting deep southwesterly flow implied by the gradient between this negative anomaly an the ridging just west of Baja help maintain the strong atmospheric river across California. with normalized PW anomaly of over 4 sigma present at 0000 UTC 20 November (not shown> |

|
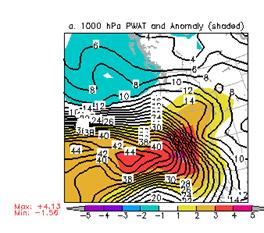
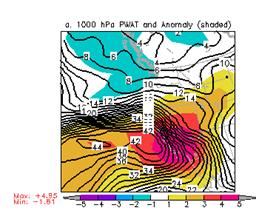
PW (mm) and normalized PW anomaly (magnitude of the anomaly scale is shown on the scale at the bottom of the figure) valid 0000 UTC 18 Nov. 1950 (top panel), 1200 UTC 18 Nov. 1950 (bottom panel). |
|
850-hPa winds (standard barbs and flags) and normalized anomaly of 850-hPa moisture flux (magnitude is given by the color fill from the bar at the bottom of the figure) valid 0000 UTC 18 Nov. 1950 (top panel), 1200 UTC 18 Nov. 1950 (bottom panel). |

|
The normalized moisture flux anomaly during this event was unusually low due to the relatively light 850 winds over California (See above), However, the atmospheric river remained almost stationary through the heaviest day of rain with the PW anomalies building to over 4 sigma by the end of the day. The normalized PW anomaly of 4.95 sigma valid at 1200 UTC 18 Nov. places the return frequency at around 10 years (see below) but given that the heavy rain season is limited to 6 months that places the return frequency even higher, probably closer to 20 years. In this case, the 850 moisture flux anomalies were above normal but were lower than during most of the other 20 extreme events. |