This document describes the procedure employed to generate anomaly correlation values for the NCEP Medium Range Forecast Desk (MRFD) and the available model guidance. The first section discusses the data source and computation of climatological parameters. Section 2 deals with the comparison of individual forecasts to the NCEP surface analysis and generation of the verification database.
The climatological parameters required for the computation of standardized
anomaly correlations are daily means and standard deviations of the pressure
at mean sea level (PMSL). Monthly means of PMSL are available for more
than 50 years from the NCEP-NCAR reanalysis (Kistler, et al., 2001)
on a 2.5o by 2.5o latitude-longitude grid. A mean
grid for each month of the year was obtained by averaging over 41-years
(1958-1998). Similarly, a standard deviation was computed for each month
of the year using the 41 values from the series of monthly mean grids.
To get daily values, it is assumed that the parameters computed for each
month apply at the middle of the month, and both the mean and standard
deviation are interpolated linearly to a specific day. Leap days are treated
as 01 March.
This method of computing the standard deviation may yield a smaller
value than would be obtained by using daily data. This is not considered
problematic because the standard deviation is used as a normalizing factor
to compensate for the tendency of the anomalies to be greater at higher
latitudes where the standard deviation is also larger (Hughes, 1992). Even
if daily data had been used, significant running averaging would have been
necessary to produce a smoothly varying series of daily standard deviation
values.
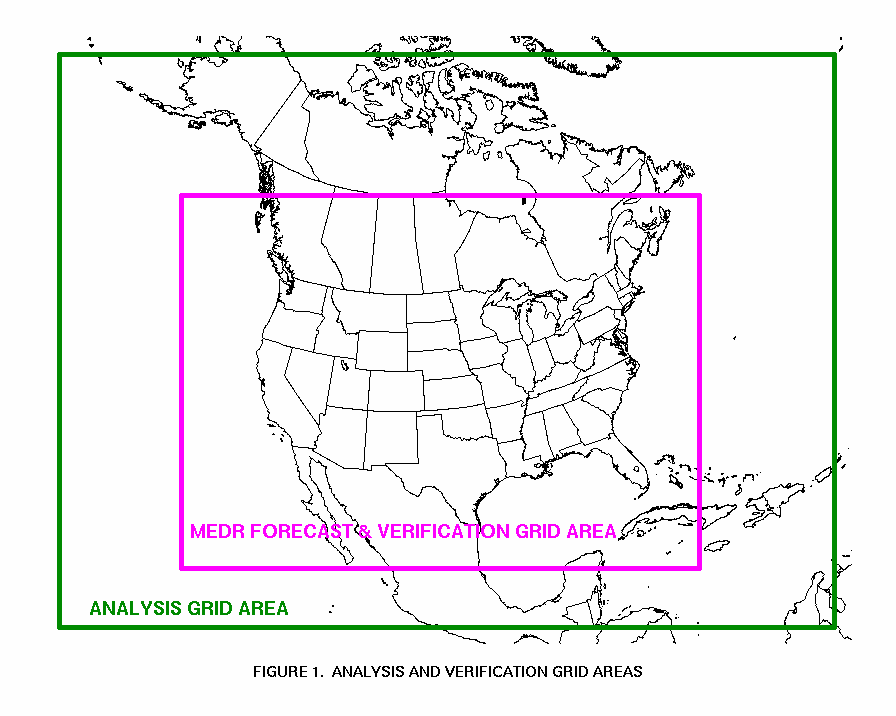
The verifying analysis is that produced by the WPC surface analysis
desk. It is gridded on a polar stereographic grid with approximate resolution
of 78 km. This grid covers the area within the outer box in Fig.
1. The inner box in Fig. 1 is the area covered
by the MRFD grid, which has approximately 80-km resolution. All of the
guidance models except for the UK Met Office model (UKMET), the European
Center for Medium-Range Weather Forecasting (ECMWF) model, and the NCEP
Global Forecast System (GFS)
Medium Range Forecasting (MRF) model ensemble mean are on a one degree
resolution (approximately 71-km mean longitudinal resolution) latitude-longitude
grid. The UKMET, ECMWF, and GFS MRF ensemble mean output is on a 2.5o
by 2.5o latitude-longitude grid having an approximate longitudinal
resolution of 179 km. For the latter models, the 78-km resolution analysis
is smoothed using a Gaussian weighted filter before
interpolation to the verification grid.
This slight smoothing results in a fairer comparison
of features depicted at a resolution of 179 km against features depicted
at 78-km resolution. The verification grid is the MRFD
grid (~80-km resolution).
As necessary either or both the analysis and forecast are interpolated bilinearly to the verification grid. Then the climatological values are obtained and interpolated bilinearly to the verification grid. The standardized anomaly is computed at each point for both the forecast and the analysis by subtracting the climatological mean and then dividing by the climatological standard deviation (Hughes, 1992). The correlation between the forecast and analyzed standardized anomalies are computed over the entire verification grid (8829 grid points).
Hughes, F. D., 1992: Skill of Medium Range Forecasts. NCEP Office note 385, 32 pp. [Available from NCEP, 5200 Auth Road, Washington, DC 20233.]
Kistler, R., and Coauthors, 2001: The NCEP-NCAR 5-year reanalysis: Monthly means CD-ROM and documentation. Bull. Amer. Meteor. Soc., 82, 247--267.