|
The ensemble members definitely suggest heavy rainfall is likely across the Gulf states. However, it’s important to remember that the GFS ensemble members only have their initial conditions perturbed so they may not have sufficient diversity. Also, the lower resolution of the GFS based ensembles members compared to the operational GFS may also make it more difficult for them to predict the higher thresholds of rainfall than the GFS. Also, they will likely suffer the same biases as the GFS in terms of the location of the maximum rainfall. |
|
A number of researchers have suggested that when trying to forecast mesoscale events and precipitation that not only do you need to perturb the initial conditions but also need to perturb various parameterization schemes (Mullen et al.1999) in order for ensemble systems to have a sufficient range of solutions to properly capture the uncertainty in a forecast situation. The SREFS makes an attempt to capture at least a part of this uncertainty by also perturbing the physics. UCAR offers a matrix that provides information on how the GEFS and SREFS are perturbed, see see http://meted.ucar.edu/nwp/pcu2/ens_matrix/. |
|
Based on the two sets of ensemble products and your knowledge of the GEFS and SREF ensemble guidance which is the least true. |
|
The ensembles members suggest that the NAM maximum rainfall may be too light. |
|
The SREF ensemble members will typically show more spread than the GEFS members. |
|
The ensemble members suggest there is a high probability of over 3 inches during the event and that there is some potential for over 5 inches. |
|
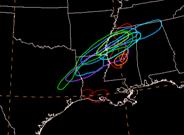
The ensemble members suggest that the highest threat for over 3-inches of rain extends along an axis from central and northern Louisiana into central or northern Mississippi. |

|
24 hr 3 inch spaghetti diagrams valid 1200 UTC 17 Oct. 2006 |
|
SREF members, eta members are red/yellow, rsm members are blue/purple and wrf members are green. |
|
GEFS members, only initial conditions are perturbed. |

|
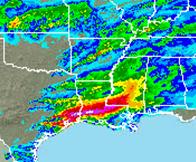
24 hr observed accumulated precipitation valid 1200 UTC 17 Oct 2006. Magenta is over 6 inches, white over 10. |
|
24 hr GEFS member 3-inch contours valid 1200 UTC 17 Oct. 2006. |

|
24 hr SREF member 3-inch contours valid 1200 UTC 17 Oct. 2006. |
|
The axis of the observed precipitation maximum was southwest of where the axis was predicted by any GEFS member (see below). Also, the axis was more east-west oriented than forecast. The maximum was south of all but two SREFS members, both of the members being ETA members with the BMJ convective scheme. |
|
So far, we’ve mainly focused on the synoptic scale and to a certain extent have neglected an ingredients based approach. Let’s complete the picture and also discuss how any MCS that forms might align compared the model forecast of the precipitation axis. |
|
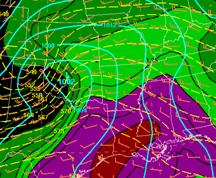
24 hr NAM mslp, boundary layer wind and temperature v.t. 00Z 27 Oct, 2006
|
|
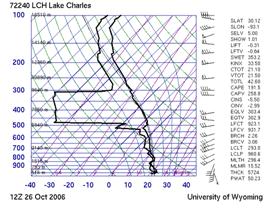
One of the most worrisome aspects of the forecast is whether the surface boundary predicted to be across Louisiana at the beginning of the period will lift northward or not. The low predicted low level convergence over eastern Texas and southwestern Louisiana argue that convection may already be going on at 1200 UTC 26 Oct. While no forecast sounding is available for this case, the observed sounding for Lake Charles for the same time argues that convection probably had already started in southwestern Louisiana. The sounding also shows little shear between 850-hPa and 300-hPa suggesting any convection that organizes into a system may be slow moving. Note that the predicted CMF vectors (see below) suggest that any MCS will be slow moving and may move more eastward than northeastward. |
|
Observed LCH sounding for 1200 UTC 26 Oct. 2006. |
|
12-hr NAM forecast of , boundary layer theta-e, winds and moisture convergence v.t. 1200 UTC 26 Oct. 2006. . |

|
The relatively low LCL suggested by the sounding also argues for a fairly low cloud base. The high relatively humidity and high PWs argue for heavy rainfall rates. |
|
A 2006 in-house study by Barthold indicated that the location of the GFS rainfall maximum was much more likely to be predicted too far north versus too far south. This is consistent with one of the known biases of the Arakawa Schubert scheme (A/S) that is mentioned in the UCAR Model Matrix which notes that bulls-eyes from the A/S scheme have their convection form too late and too far north along the sloped frontal surface rather than near to the warm air where the actual convection usually develops. The SREF ensemble members offered a better idea of the threat area having it extend from southwestern Louisiana into southeastern Arkansas and northern Mississippi. However, its members will often cluster based on their convective schemes with the A/S and Kain-Fritsch members in one group and the Eta members that use the BMJ scheme in another so even the SREF members may not have enough diversity. |
|
For more on using standardized anomalies as a forecasting tool, click here. |