|
Hurricanes and extreme rainfall. |
|
Hurricanes, tropical systems and depressions pose a special forecast problem. Tropical storms and hurricanes or their remains are capable of producing extremely heavy rainfall and often produce serious flooding and flash flooding. A presentation by Rusty Pfost documented some of the more impressive rainfall associated with tropical cyclones. He notes that rainfall rates of up to 6 inches per hour have been reported and that 43 inches of rain was reported in 24 hours at Alvin, Texas as a result of the remains of Tropical Storm Claudette. Flooding resulting from the rainfall associated with tropical systems accounted for 292 deaths during the 1970-1999 which was 59% of the total deaths from tropical systems (Rappaport et al. 1999).
HPC quantitative precipitation forecasts are to a certain extent dependent of the track of the system provided by the Tropical Prediction Center. Forecasts are usually modeled to the NHC track with amounts to a certain extent dependent on the size of the storm and its speed. However, the amount of rainfall that a storm produces does not appear to be related to the intensity of the storm. The Rappaport et al. study suggests that there is no apparent relationship between the intensity of the tropical cyclone at landfall and the number of rainfall induced deaths that occur because of the storm.
The heaviest rainfall associated with tropical systems usually falls along or near the coast and typically occurs slightly to the right of the track of the storm. A 46 storm composite of the average 48 hr rainfall is offered below (Goodyear 1968). The same study indicates that there is about a 50% chance that the period of heaviest rainfall will occur in the 12-h period starting 6 hours prior to landfall and ending 6 hours after landfall. The 6 hour period just prior to landfall is the period most likely to receive the maximum 6 hourly accumulations during the storm. |

|
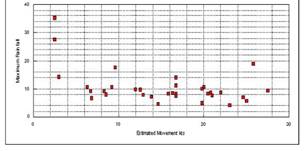
Another study, done more recently by Rusty Pfost, for hurricanes with a landfall in Florida, found that the maximum rainfall was usually a little to the east of the storm. However, Pfost found a few exceptions (see figure below). The maximum rainfall usually falls within the eyewall or with the spiral bands and occur where the frictional convergence is maximized on the east side of the storm. Unfortunately, some storms are highly asymmetric and have more convection on the west side of the storm than the east. Others may be highly sheared with most of their convection located well east of the center. |

|
Forecasters in the in the 60s and 70s often used a rule of thumb (the Kraft rule of thumb technique) to estimate the rainfall associated with tropical systems. |
|
Maximum rainfall (inches)=100/speed (in knots) |
|
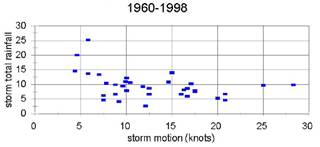
Northern Gulf coast storms |
|
Florida landfall storms |
|
The two graphs above argue that forecasters should not wed themselves to the Kraft technique. The second fastest moving northern Gulf of Mexico landfall storm produced the third highest precipitation maximum of all northern Gulf storms. On both graphs above, a curve has been drawn to try to best fit the points. The slope of both curves is very flat except at speeds below 10 knots where the slope steepens. The lack of a well defined relationship between the speed of the cyclone and its associated precipitation maximum should come as no surprise since the Kraft method fails to take into account the following: 1)the size of the storm, 2) the amount of convection associated with it, 3) that some storms are asymmetric due to shear and 4) the impact of nearby fronts. The graphs suggest that the maximum storm total rainfall will be in the 5 to 10 inch range for storms moving between 6 and 30 knots. The rainfall maxima for storms moving slower than 6 knots was usually above 15 inches. |


|
The Satellite Tropical Rainfall Potential (TRaP) technique provides another more scientifically based method of estimating the rainfall potential of a tropical cyclone as it makes landfall (Kidder et al. 2005). Equation used to determine the rainfall using the TRaP technique is provided in the figure below. |
|
Where Ravg is the hourly rainfall rates measured by the satellite sensors, D is the measure length along the axis of the storms movement and V is the velocity of the storm. The speed and direction that TRaP uses for its rainfall predictions comes from the NHC forecast tracks. |

|
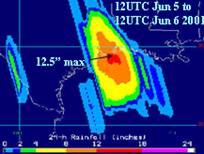
TRaP rainfall forecast |
|
Eta model forecast |

|
Multi-sensor observed rainfall analysis |
|
The technique’s precipitation projections were quite a bit better than the Eta’s. If a storm changes little in character and the NHC track is fairly accurate, the TRaP rainfall should provide a pretty good estimate of the system’s rainfall potential at landfall. |
|
TRaP assumes that the rainfall rates measured by the satellite sensors are accurate, that the precipitation rates and distribution of precipitation within and around the storm will remain the same with the same. It fails to take into account changes due to eyewall replacement, changes that are taking place in the environment around the storm that may impact it. For example, dry air being entrained into the storm or changes in the shear, both of which can impact the structure of the storm.
|

|
Bosart and Dean (1991) have offered a schematic of the mid-tropospheric streamlines associated with possible tropical storm related flooding. The southern area is associated with the forcing of the storm itself, while the northern area is usually associated with moisture interacting with a frontal boundary. Strong frontogenesis is often occurring within this area. Where the heaviest rainfall will be located relative to the storm is strongly related to its structure.
The next few pages will attempt to explain how the storms structure can influence its area distribution of rainfall. Remember that convection and heavy rainfall related to a tropical system but not directly due to it can develop well in advance of the storm along a boundary, the entrance region of a jet streak or along the upwind side of a mountain range (Cote 2007). |
|
From Bosart and Dean 1991 |
|
Adapted form PFost Powerpoint Presentation |
|
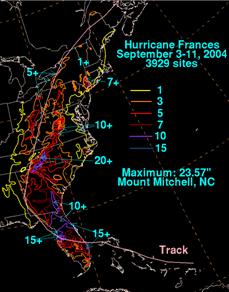
Roth (personal communication) has noted that there are a number of factors that modulate the distribution of rainfall associated with tropical cyclones. Storm size, morphology, track, interaction with synoptic and mesoscale features and even the time of day can impact the precipitation associated with the storm. He offered the figure at left to illustrate how complex the precipitation pattern can be. The heaviest rainfall remained on the east side of the storm as it moves across southern Georgia. |
|
As illustrated by the figure above, how to forecast the distribution of rainfall associated with a tropical system becomes more difficult once it moves inland and turns towards the north or northeast and gains latitude. The chances of entraining dry air into some quadrant of the storm increases as it moves away from the coast, which increases its chances of becoming asymmetric. Also, as a storm turns northward, it often starts to interact with a mid-level trough. When this occurs, the axis of heaviest precipitation then often falls to the west of the track of the surface center. The proximity to a mid-level trough and increase in latitude raise the chances that the storm might interact with a frontal boundary. |
|
As it approached the Appalachains, strong flow into mountains produced very heavy rainfall along their east slopes and a minimum on the west side of the mountains (this minimum was very pronounced over Virginia). However, as the remains turned northeastward another maximum formed along a weak front associated with the entrance region of an upper level jet streak. Here, the maximum ended up to the west of the storm track. |
|
Images from Scofield, Kuligowski |