|
|
|
Norman (Wes) Junker |
|
National Centers for Environmental Prediction |
|
Hydrometeorological Prediction Center |
|
Camp Springs, MD |
|
|
|
|
|
Is there one best way to do PQPF? |
|
Keep man in the loop? |
|
Statistical methods applied to model output |
|
Calibrated probabilities from Enembles? |
|
Point versus the probability of occurrence
within some area? |
|
|
|
|
|
Relies on calibration of subjective forecasts of
probability. |
|
Need rain/no rain probability |
|
Uses conditional exceedence fractiles: |
|
The X50, or amount where there is an
equal chance of getting more or less precipitation that that number |
|
the X25, amount the forecaster thinks there is a 25% percent chance of
exceeding that value. |
|
Can then use curve to set probabilities for any
amount. |
|
|
|
|
LINEAR REGRESSION (MDL MOS) |
|
LOGISTIC REGRESSION (NON LINEAR) USES SAME TYPE
OF FUNCTIONAL RELATIONSHIPS AS NEURAL NETWORKS BUT HAS NO HIDDEN LAYERS |
|
DISCRIMINANT ANALYSIS |
|
NEURAL NETWORKS (NON LINEAR) |
|
CLASSIFIER SYSTEM (IF THEN STATEMENTS, SURVIVAL
OF THE FITTEST) |
|
|
|
|
|
|
|
|
|
|
|
|
|
|
Another way to assess probabilities for various
thresholds. |
|
Provides a method to take into account the
predictability of the pattern. |
|
Need to perturb initial conditions and model
physics. |
|
You assume each member has equal skill |
|
this
might be an incorrect assumption, if you are not careful how you perturb
the physics. |
|
|
|
|
|
|
|
|
|
|
Develop rank histograms based on the
precipitation forecast by each of the members. |
|
|
|
|
|
|
|
|
|
|
|
|
|
|
|
|
|
|
|
however the shape of the histograms change significantly based on
the variability of the ensemble members. |
|
So separate histograms need to be developed for
high, medium and low variability cases. |
|
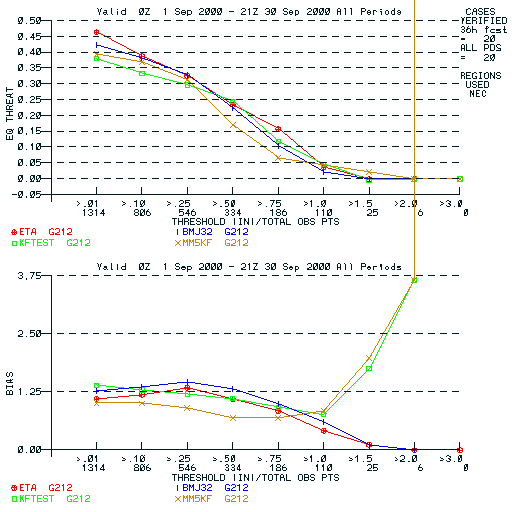
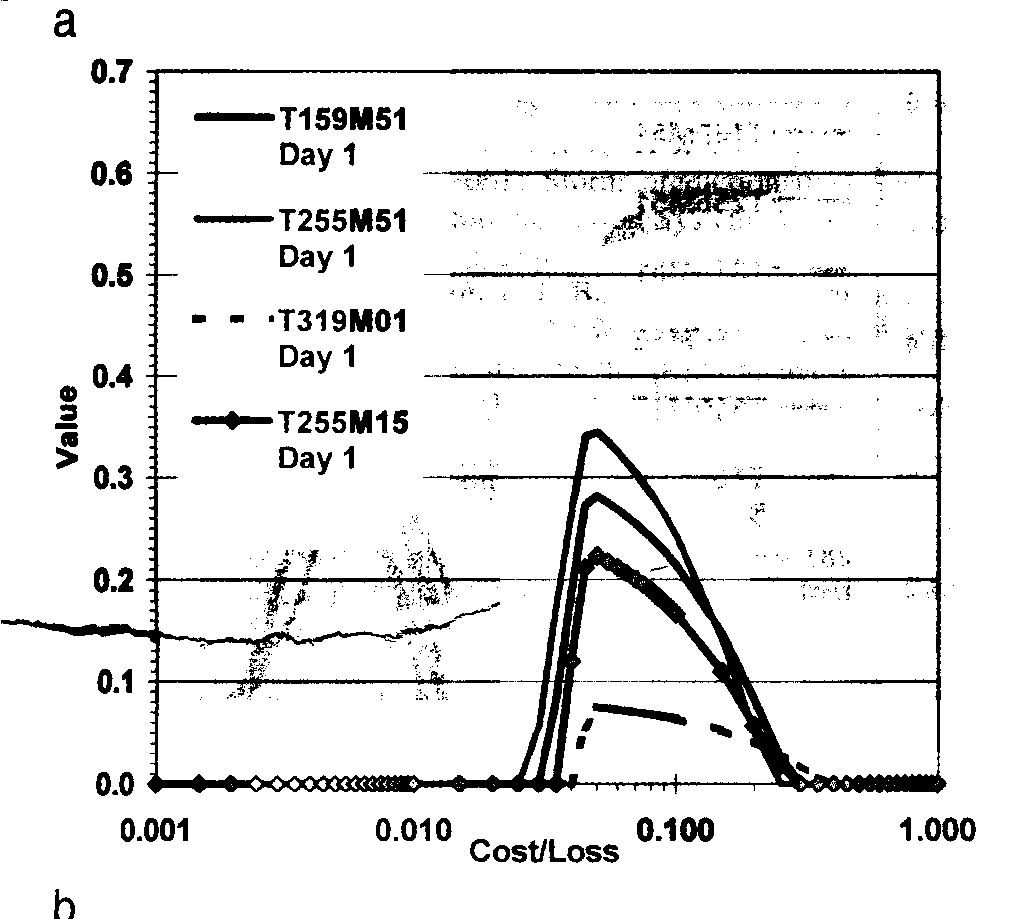
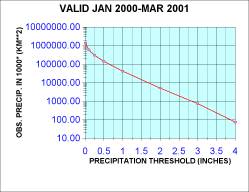
How do you handle the heaviest 10%, the extreme
rainfall events? |
|
|
|
|
|
|
More members with lower resolution? |
|
Fewer members with higher resolution? |
|
|
|
|
|
|
|
|
|
|
|
|
|
|
|
|
|
|
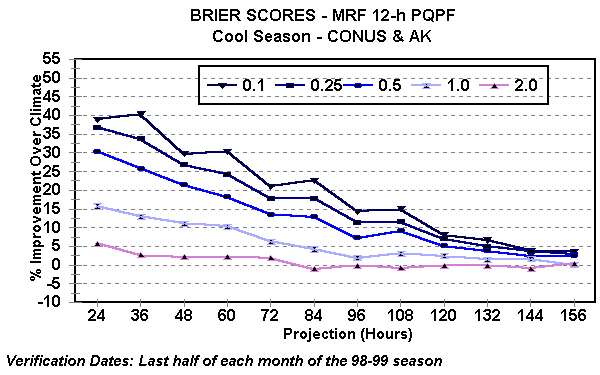
For lighter, more frequent events. |
|
MOS-type non-linear statistical approaches MAKE
SENSE. |
|
Provide WELL CALIBRATED probabilities. |
|
Calibrated ensemble methods also work well |
|
may be more computationally expensive in long
run. |
|
Statistical-man mix may be an option. Since a
forecaster might be able to take into account the predictability of the
pattern. |
|
a person
might be able to combine information from ensemble and statistical methods
to adjust POPS (this is already being done at HPC in the 3-7 day range). |
|
|
|
|
|
|
|
|
point probabilities may not always make
sense. Point probabilities will
always be very low, possibly too
low for emergency managers to act. |
|
Other methods need to be explored. |
|
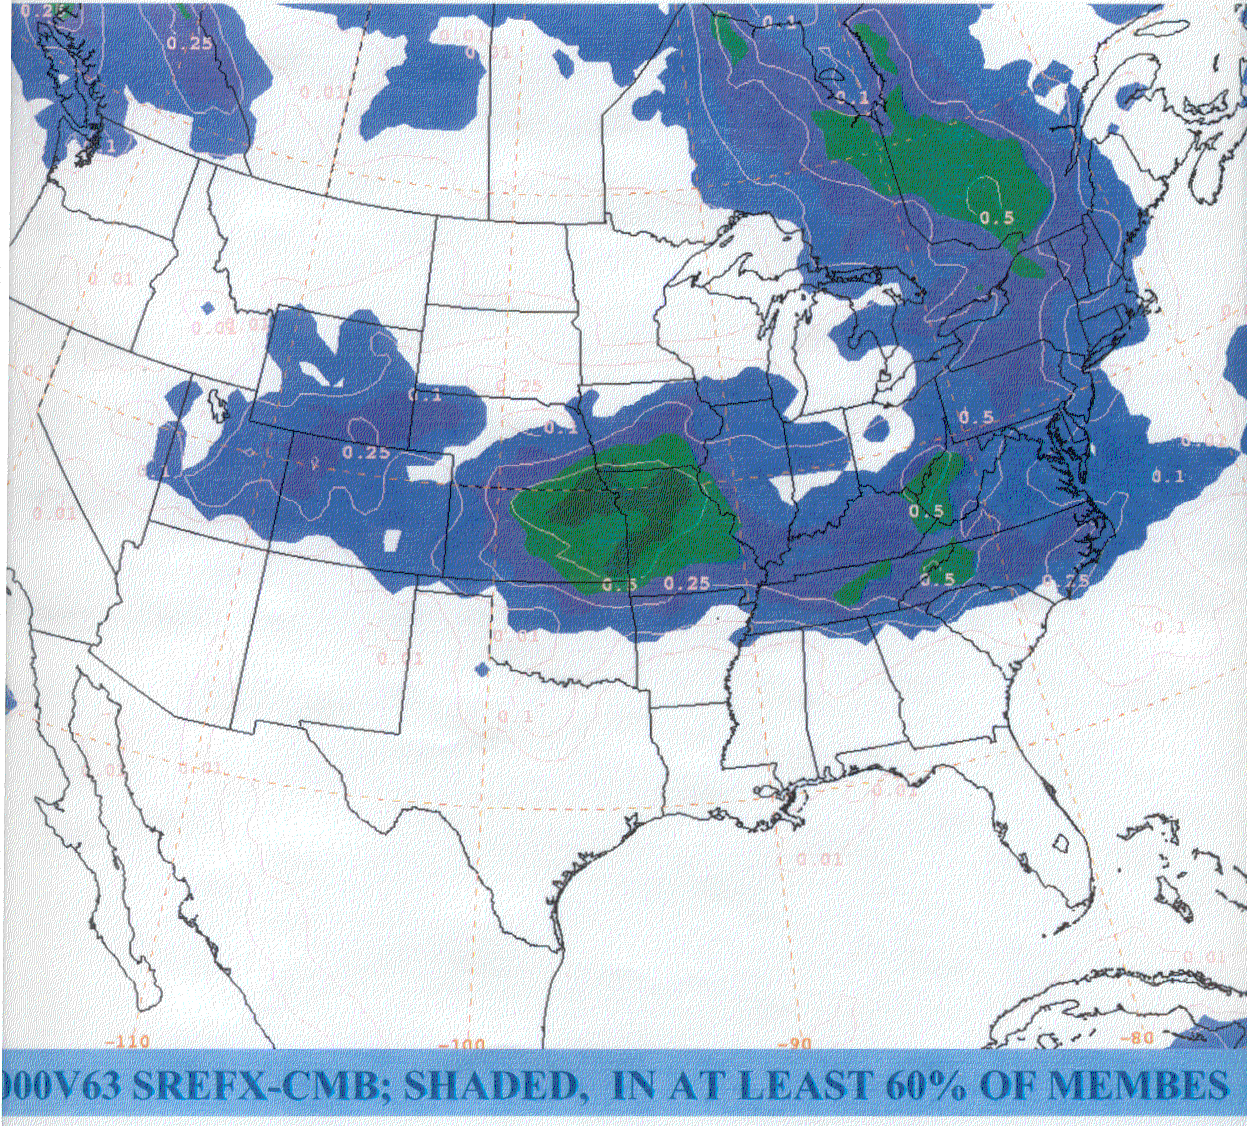
One possibility- develop probabilities of
various thresholds within a circle of some radius. Such forecasts might be useful to
emergency managers helping them decide when to put their staffs on alert |
|
Ensemble forecasts, combined with statistical
methods might be able to provide such probabilities and might be used to
determine the size of the circle.
or |
|
A single non-hydrostatic model run might provide
enough guidance to develop such probabilities if the radius of the circle
is based on error characteristics of the model. |
|
The phase error helps determine size of circle. |
|
the magnitude of the precipitation forecast be
used to help determine probabilities of occurrence within the circle for
various thresholds. |
|

 Notes
Notes