

|
Feb 1986 event |


|
Picture of the Linda levee break of 1986 (from Roos, 2007) |
|
The February 1986 event had the 5th highest 72-hour rainfall but it’s ranking is probably misleading. It had sustained rainfall during a protracted period that extended for longer than 72 hours. Note that it had two significant 72 hour rainfall periods back to back which produced in excess of 450mm in the vicinity of the Feather, American and Cosumnes River Basins and it produced the largest flood volume of any flood during the period between 1950 to 2007 on the American River Basin and the second largest on both the Feather and Cosumnes basins (Roos 2007). A return period of 1000 years was estimated for the 10-day precipitation totals in the central Sierra range. The flooding and levee breaks led to 1.5 billions of dollars in property damage (http://water.ca.gov/levees/history/floods.cfm).
The heaviest rainfall occurred on February 17th when 17.6 inches of rain was reported at Four Trees on the Feather River Basin. 29 inches of rain were reported at Calistoga and Blue Canyon, respectively, in a 10-day period. 13 people were killed due to the flooding. The extreme rainfall was not limited to California. Carson City received over 10 inches or rain during the 10-day period which is about 83 percent of the yearly normal. Flood waters virtually surrounded Reno. The flooding was declared a Federal Disaster for 5 Nevada counties and cause 17 millions of dollars in damages. Flooding from heavy rains also occurred in Box Elder County, Utah. |
|
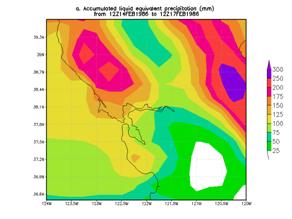
Heaviest 3-day rainfall analysis (mm) using the CDC .25 deg by .25 deg unified data set ending 1200 UCT 17 Feb. 1986 |
|
Heaviest 3-day rainfall analysis (mm) using the CDC .25 deg by .25 deg unified data set ending 1200 UCT 20 Feb. 1986 |
|
Precipitation analysis for the 24 hours (in inches) ending at 1200 UTC 17 Feb. |


|
The map above is based on (Paulson et al, U.S. Geological Survey Water-Supply Paper 2375, 591 ) and shows the areas in California were flooding was located along with an estimate of the recurrence interval of a flood of that magnitude. |
|
The synoptic pattern was cut from the same mold as most of the other events. A block with anomalously high 500-hPa heights was present over Alaska and the Bering Sea. A negative height anomaly was located to its south. This negative anomaly and another positive height anomaly to its southeast helped maintain a long southwesterly fetch which tapped the subtropics and helped pull a strong atmospheric river northeastward into California. |

|
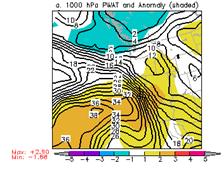
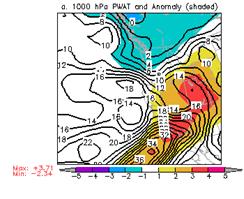
PW (mm) and normalized PW anomaly (magnitude of the anomaly scale is shown on the scale at the bottom of the figure) valid 0000 UTC 17 Feb. 1986 (top panel), 1200 UTC 17 Feb. 1986 (middle panel) and 1200 UTC 19 Feb 1986 (bottom panel). |

|
850-hPa winds (standard barbs and flags) and normalized anomaly of 850-hPa moisture flux (magnitude is given by the color fill from the bar at the bottom of the figure) valid 0000 UTC 17 Feb. 1963 (top panel), 1200 UTC 17 Feb. 1963 (bottom panel). |

|
An anomalously strong atmospheric river extended across California for an extended period of time. Normalized PW anomalies grew to above 3 over CA by 1200 UTC 17 Nov and remained over 3 through 1200 UTC 19 Nov. Normalized MF were above 3 from 0000 UCT 17 Feb through 1200 UTC 19 Feb and with the values exceeded 4 during most of the period. The slow movement of the moisture plume led to two consecutive 3 day periods of heavy rainfall. |