
|
December 1964 extreme rainfall event |

|
The 1200 UTC 20 Dec-1200 UTC 23 December 1964 ranked had the highest ranking for a 3 day period with a maximum grid point value of 432.15 mm. Its maximum rainfall remained primarily to the north of San Francisco. However, the associated flooding ranked in the top 10 in the 1949-1998 period with damages of 1.13 billion dollars (in 1998 dollars). The event produced significant flooding along the North Coast of California with 34 California counties being declared disaster areas.
The event also contributed to significant flooding in Idaho where the Payette, Big Wood, Little Wood, Portneuf, Clearwater and Boise River drainages. Over 100 houses were damaged and thousands of acres of farmlands were flooding. The flooding on the Payette was the largest ever recorded. The estimated cost of the flooding was 21 million dollars |

|
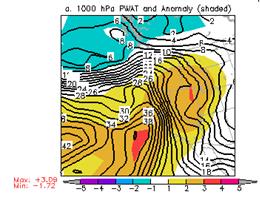
PW (mm) and normalized PW anomaly (magnitude is given by the color fill from the bar at the bottom of the figure) valid 1800 UTC 21 Dec 1964 Top) and 1200 UTC 22 December 1964 (bottom) |
|
72-hr CDC QPE (mm) from 1200UTC 20 Dec. to 1200 UTC 23 Dec. 1964 |
|
The synoptic pattern associated with this particular event is a blueprint for the majority of the other ranked events. Most 500-hPa analysis during these events had a high latitude positive anomaly in the vicinity of Alaska and the Bering Strait, a negative height anomaly to its south and then a another positive anomaly to the south of the negative (see top right panel of the figure below). The juxtaposition of the negative anomaly with the southern positive anomaly provides a strong geopotential height gradient suggesting strong geostrophic winds. Above normal 850 temperatures were also present which led to high snow levels. |
|
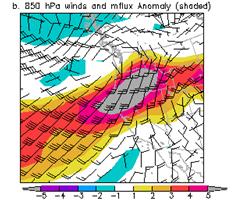
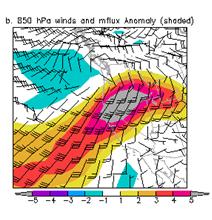
850-hPa winds (standard barbs and flags) and normalized anomaly of 850-hPa moisture flux (magnitude is given by the color fill from the bar at the bottom of the figure) valid 1800 UTC 21 Dec. 1964 Top) and 1200 UTC 22 December 1964 (bottom) |
|
Large area 4-panel chart, 200-hPa heights and isotachs (top left), 500-hPa heights and normalized height anomaly (top right), 850-hPa heights and normalized temperature anomaly (bottom left), and 1000-hPa height and normalized PW anomaly (bottom right) valid 0000 UTC 22 Dec. 1964. The magnitude of the normalized anomalies are given by the color fill with the scale on the left had side of each panel. |
|
Another common trait was a strong low-level pressure or geopotential height gradient that suggest strong west-southwesterly or southwesterly geostrophic winds. Note the strong gradient at 1000-hPa and 850-hPa on the figure above and the strong 850-hPa winds on the figure below. Other commonalities were the anomalously high PW and 850-hPa moisture flux. The maximum precipitable water (PW) within the atmospheric river was over 30 mm which classifies to river as a strong one (Neiman et al 2007). During the 1964 case the normalized anomaly for PW exceeded 3s and the moisture flux anomaly exceeded 5s (see figures below). The normalized MF anomaly of over 5 suggests a return frequency of at least 18 months (about 3 years) suggesting that the atmospheric river of such strength is a relatively rare occurrence. The extended period of such anomalous MF would probably be even rarer. It’s also important to note that anomalies of greater than 6s are not depicted but might still be present within the area of greater than 5s departures. |


|
The map above is based on (Paulson et al, U.S. Geological Survey Water-Supply Paper 2375, 591 ) and shows the areas in California were flooding was located along with an estimate of the recurrence interval of a flood of that magnitude. |
|
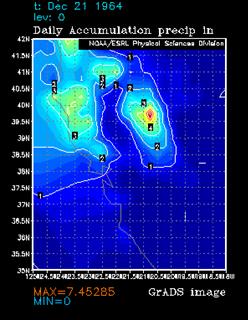
Precipitation analysis of the 24 hours (in inches) ending at 1200 UTC 21 Dec 1964 from the .25 by 2.5 deg. unified data set. |
|
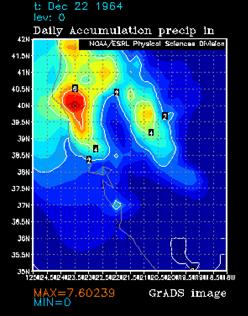
Precipitation analysis of the 24 hours (in inches) ending at 1200 UTC 22 Dec 1964 from the .25 by 2.5 deg. unified data set. |
|
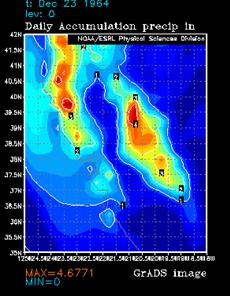
Precipitation analysis of the 24 hours (in inches) ending at 1200 UTC 23 Dec 1964 from the .25 by 2.5 deg. unified data set. |
|
Note that the axis of strongest moisture flux also seems to relate to the area of heaviest rainfall and the area where the return frequency for flooding was considered a greater than 50 year event. |